Open demo

CSS code

HTML
<div class="cw-grid">
<div><span class="lbl">Bar chart</span>
<article class="cw" data-chart="bar" data-format="number">
  <div class="cw-head"><div><h3 class="cw-title">Orders by weekday</h3><p class="cw-sub">Week of Oct 5, 2026 · 6,911 orders</p></div>
    <button type="button" class="cw-toggle" data-chart-toggle aria-controls="cw-orders" hidden>Show table</button></div>
  <div class="cw-canvas" data-chart-canvas></div>
  <div class="cw-table" id="cw-orders" data-chart-table>
    <table><caption>Orders by weekday, week of Oct 5, 2026</caption>
      <thead><tr><th scope="col">Day</th><th scope="col">Orders</th></tr></thead>
      <tbody>
        <tr><th scope="row">Mon</th><td data-value="842">842</td></tr>
        <tr><th scope="row">Tue</th><td data-value="913">913</td></tr>
        <tr><th scope="row">Wed</th><td data-value="1027">1,027</td></tr>
        <tr><th scope="row">Thu</th><td data-value="968">968</td></tr>
        <tr><th scope="row">Fri</th><td data-value="1284">1,284</td></tr>
        <tr><th scope="row">Sat</th><td data-value="1146">1,146</td></tr>
        <tr><th scope="row">Sun</th><td data-value="731">731</td></tr>
      </tbody></table>
  </div>
</article></div>

<div><span class="lbl">Donut chart with legend</span>
<article class="cw" data-chart="donut" data-format="usd">
  <div class="cw-head"><div><h3 class="cw-title">Revenue by channel</h3><p class="cw-sub">Q3 2026 · $480,000 total</p></div>
    <button type="button" class="cw-toggle" data-chart-toggle aria-controls="cw-channels" hidden>Show table</button></div>
  <div class="cw-donut"><div class="cw-canvas" data-chart-canvas></div><ul class="cw-legend" data-chart-legend aria-hidden="true"></ul></div>
  <div class="cw-table" id="cw-channels" data-chart-table>
    <table><caption>Revenue by channel, Q3 2026</caption>
      <thead><tr><th scope="col">Channel</th><th scope="col">Revenue</th><th scope="col">Share</th></tr></thead>
      <tbody>
        <tr><th scope="row">Organic search</th><td data-value="182400">$182,400</td><td>38%</td></tr>
        <tr><th scope="row">Paid social</th><td data-value="115200">$115,200</td><td>24%</td></tr>
        <tr><th scope="row">Email</th><td data-value="96000">$96,000</td><td>20%</td></tr>
        <tr><th scope="row">Referral</th><td data-value="86400">$86,400</td><td>18%</td></tr>
      </tbody></table>
  </div>
</article></div>

<div class="is-wide"><span class="lbl">Area chart</span>
<article class="cw" data-chart="line" data-format="usd-compact">
  <div class="cw-head"><div><h3 class="cw-title">Monthly recurring revenue</h3><p class="cw-sub">Jan–Oct 2026 · up 49.2% since January</p></div>
    <button type="button" class="cw-toggle" data-chart-toggle aria-controls="cw-mrr" hidden>Show table</button></div>
  <div class="cw-canvas" data-chart-canvas></div>
  <div class="cw-table" id="cw-mrr" data-chart-table>
    <table><caption>Monthly recurring revenue, January to October 2026</caption>
      <thead><tr><th scope="col">Month</th><th scope="col">MRR</th></tr></thead>
      <tbody>
        <tr><th scope="row">Jan</th><td data-value="86410">$86,410</td></tr>
        <tr><th scope="row">Feb</th><td data-value="90120">$90,120</td></tr>
        <tr><th scope="row">Mar</th><td data-value="94730">$94,730</td></tr>
        <tr><th scope="row">Apr</th><td data-value="99050">$99,050</td></tr>
        <tr><th scope="row">May</th><td data-value="104200">$104,200</td></tr>
        <tr><th scope="row">Jun</th><td data-value="108870">$108,870</td></tr>
        <tr><th scope="row">Jul</th><td data-value="112640">$112,640</td></tr>
        <tr><th scope="row">Aug</th><td data-value="117420">$117,420</td></tr>
        <tr><th scope="row">Sep</th><td data-value="123860">$123,860</td></tr>
        <tr><th scope="row">Oct</th><td data-value="128940">$128,940</td></tr>
      </tbody></table>
  </div>
</article></div>
</div>
CSS
/* Chart cards. Each card holds a real <table>: the script reads it, draws an SVG chart from it and then
   hides the table visually (it stays readable by screen readers). "Show table" brings it back on screen.
   Without JavaScript the table is simply shown. Chart colours are custom properties on .cw. */
.cw-grid{display:grid;grid-template-columns:repeat(auto-fit,minmax(min(100%,380px),1fr));gap:36px 18px}
.cw-grid>.is-wide{grid-column:1/-1}
.cw{--c1:#2a78d6;--c2:#eb6834;--c3:#1baf7a;--c4:#eda100;--ink:#0f172a;--muted:#4b5768;--grid:#e2e8f0;--surface:#fff;
  background:var(--surface);color:var(--ink);border:1px solid var(--grid);border-radius:16px;padding:18px 18px 16px;
  box-shadow:0 1px 2px rgba(15,23,42,.04),0 8px 24px rgba(15,23,42,.05);display:flex;flex-direction:column;gap:12px;min-width:0}
.cw-head{display:flex;justify-content:space-between;align-items:flex-start;gap:12px}
.cw-title{font-size:1rem;font-weight:700}
.cw-sub{font-size:.8rem;color:var(--muted);font-variant-numeric:tabular-nums}
.cw-toggle{flex:none;font:inherit;font-size:.78rem;font-weight:600;color:#1f5fae;background:#fff;border:1px solid #9bb3cf;border-radius:8px;
  padding:5px 10px;cursor:pointer;transition:background .15s}
.cw-toggle:hover{background:#eef4fb}
.cw-toggle:focus-visible{outline:2px solid #1f5fae;outline-offset:2px}
.cw-toggle[hidden]{display:none}
.cw-canvas{min-height:0}
.cw-canvas svg{display:block;width:100%;height:auto;overflow:visible}
.cw-donut{display:flex;align-items:center;gap:22px;flex-wrap:wrap}
.cw-donut .cw-canvas{flex:0 0 170px}
.cw-legend{flex:1 1 160px;list-style:none;display:grid;gap:8px;font-size:.84rem}
.cw-legend li{display:grid;grid-template-columns:12px 1fr auto auto;align-items:center;gap:8px;font-variant-numeric:tabular-nums}
.cw-legend i{width:12px;height:12px;border-radius:3px}
.cw-legend b{font-weight:700}
.cw-legend span:last-child{color:var(--muted);min-width:3ch;text-align:right}
.cw-table{overflow-x:auto}
.cw-table table{width:100%;border-collapse:collapse;font-size:.84rem;font-variant-numeric:tabular-nums}
.cw-table caption{text-align:left;font-size:.74rem;color:var(--muted);padding-bottom:6px}
.cw-table th,.cw-table td{padding:6px 8px;border-bottom:1px solid var(--grid);text-align:left}
.cw-table thead th{font-size:.74rem;text-transform:uppercase;letter-spacing:.06em;color:var(--muted)}
.cw-table td,.cw-table thead th+th{text-align:right}
.cw-table tbody th{font-weight:500}
.sr-only{position:absolute;width:1px;height:1px;padding:0;margin:-1px;overflow:hidden;clip:rect(0,0,0,0);white-space:nowrap;border:0}
@media (prefers-reduced-motion:reduce){.cw-toggle{transition:none}}
JavaScript
// Draws each [data-chart] card from its own <table>: "bar", "line" (area) or "donut". No library.
// The table stays in the page for screen readers (visually hidden) and "Show table" puts it back on screen.
(() => {
  const HIDE = 'sr-only';
  const fmt = {
    number: new Intl.NumberFormat('en-US'),
    usd: new Intl.NumberFormat('en-US', { style: 'currency', currency: 'USD', maximumFractionDigits: 0 }),
    'usd-compact': new Intl.NumberFormat('en-US', { style: 'currency', currency: 'USD', notation: 'compact', maximumFractionDigits: 1 })
  };
  const r1 = n => Math.round(n * 10) / 10;
  const esc = s => s.replace(/[&<>"]/g, c => ({ '&': '&', '<': '<', '>': '>', '"': '"' })[c]);
  const niceStep = (range, steps) => { const raw = range / steps, mag = 10 ** Math.floor(Math.log10(raw || 1)); return [1, 2, 2.5, 5, 10].map(s => s * mag).find(s => s >= raw); };

  const draw = {
    bar(rows, w, c, f) {
      const h = 200, top = 22, base = h - 26, band = (w - 8) / rows.length, bw = Math.min(38, band * .62);
      const max = Math.max(...rows.map(r => r.value));
      let s = `<svg viewBox="0 0 ${w} ${h}" width="${w}" height="${h}" aria-hidden="true" focusable="false">`;
      rows.forEach((r, i) => {
        const x = 4 + band * i + (band - bw) / 2, y = base - (r.value / max) * (base - top), rr = Math.min(4, bw / 3);
        s += `<path fill="${c.c1}" d="M${r1(x)} ${base}V${r1(y + rr)}Q${r1(x)} ${r1(y)} ${r1(x + rr)} ${r1(y)}H${r1(x + bw - rr)}Q${r1(x + bw)} ${r1(y)} ${r1(x + bw)} ${r1(y + rr)}V${base}Z"><title>${esc(r.label)}: ${f.format(r.value)}</title></path>`;
        s += `<text x="${r1(x + bw / 2)}" y="${r1(y - 6)}" text-anchor="middle" font-size="11" font-weight="600" fill="${c.ink}">${f.format(r.value)}</text>`;
        s += `<text x="${r1(x + bw / 2)}" y="${h - 8}" text-anchor="middle" font-size="11" fill="${c.muted}">${esc(r.label)}</text>`;
      });
      return s + `<line x1="0" x2="${w}" y1="${base}" y2="${base}" stroke="${c.axis}" stroke-width="1"/></svg>`;
    },
    line(rows, w, c, f) {
      const h = 220, top = 18, base = h - 26, left = 46, right = w - 12, vals = rows.map(r => r.value);
      const step = niceStep(Math.max(...vals) - Math.min(...vals), 4);
      const lo = Math.floor(Math.min(...vals) / step) * step, hi = Math.ceil(Math.max(...vals) / step) * step;
      const x = i => left + i * (right - left) / (rows.length - 1), y = v => base - (v - lo) / (hi - lo) * (base - top);
      let s = `<svg viewBox="0 0 ${w} ${h}" width="${w}" height="${h}" aria-hidden="true" focusable="false">`;
      for (let v = lo; v <= hi + step / 2; v += step) s += `<line x1="${left}" x2="${right}" y1="${r1(y(v))}" y2="${r1(y(v))}" stroke="${v === lo ? c.axis : c.grid}" stroke-width="1"/><text x="${left - 8}" y="${r1(y(v) + 4)}" text-anchor="end" font-size="11" fill="${c.muted}">${f.format(v)}</text>`;
      const every = (right - left) / rows.length < 34 ? 2 : 1;
      const pts = rows.map((r, i) => [r1(x(i)), r1(y(r.value))]);
      const d = pts.map((p, i) => `${i ? 'L' : 'M'}${p[0]} ${p[1]}`).join('');
      s += `<path d="${d}L${pts.at(-1)[0]} ${base}L${pts[0][0]} ${base}Z" fill="${c.c1}" fill-opacity=".12"/>`;
      s += `<path d="${d}" fill="none" stroke="${c.c1}" stroke-width="2" stroke-linejoin="round" stroke-linecap="round"/>`;
      rows.forEach((r, i) => {
        if ((rows.length - 1 - i) % every === 0) s += `<text x="${pts[i][0]}" y="${h - 8}" text-anchor="middle" font-size="11" fill="${c.muted}">${esc(r.label)}</text>`;
        s += `<circle cx="${pts[i][0]}" cy="${pts[i][1]}" r="${i === rows.length - 1 ? 5 : 3.5}" fill="${c.c1}" stroke="${c.surface}" stroke-width="2"><title>${esc(r.label)}: ${esc(r.text)}</title></circle>`;
      });
      const last = pts.at(-1);
      return s + `<text x="${last[0] - 10}" y="${last[1] - 12}" text-anchor="end" font-size="12" font-weight="700" fill="${c.ink}">${f.format(vals.at(-1))}</text></svg>`;
    },
    donut(rows, w, c, f, card) {
      const total = rows.reduce((a, r) => a + r.value, 0), cols = [c.c1, c.c2, c.c3, c.c4];
      let s = '<svg viewBox="0 0 170 170" width="170" height="170" aria-hidden="true" focusable="false"><g transform="rotate(-90 85 85)">', at = 0;
      rows.forEach((r, i) => {
        const p = r.value / total * 100;
        s += `<circle cx="85" cy="85" r="64" fill="none" stroke="${cols[i % 4]}" stroke-width="26" pathLength="100" stroke-dasharray="${r1(p - .8)} ${r1(100 - p + .8)}" stroke-dashoffset="${r1(-at)}"><title>${esc(r.label)}: ${esc(r.text)}</title></circle>`;
        at += p;
      });
      s += `</g><text x="85" y="84" text-anchor="middle" font-size="20" font-weight="750" fill="${c.ink}">${new Intl.NumberFormat('en-US', { style: 'currency', currency: 'USD', notation: 'compact' }).format(total)}</text><text x="85" y="103" text-anchor="middle" font-size="11" fill="${c.muted}">total</text></svg>`;
      const legend = card.querySelector('[data-chart-legend]');
      if (legend) legend.innerHTML = rows.map((r, i) => `<li><i style="background:${cols[i % 4]}"></i><span>${esc(r.label)}</span><b>${esc(r.text)}</b><span>${Math.round(r.value / total * 100)}%</span></li>`).join('');
      return s;
    }
  };

  document.querySelectorAll('[data-chart]').forEach(card => {
    const type = card.dataset.chart, canvas = card.querySelector('[data-chart-canvas]'), wrap = card.querySelector('[data-chart-table]');
    const btn = card.querySelector('[data-chart-toggle]'), table = wrap && wrap.querySelector('table');
    if (!draw[type] || !canvas || !table) return;
    const rows = [...table.tBodies[0].rows].map(tr => ({ label: tr.cells[0].textContent.trim(), value: parseFloat(tr.cells[1].dataset.value), text: tr.cells[1].textContent.trim() }));
    const f = fmt[card.dataset.format] || fmt.number;
    const colors = () => {
      const css = getComputedStyle(card), v = (n, d) => css.getPropertyValue(n).trim() || d;
      return { c1: v('--c1', '#2a78d6'), c2: v('--c2', '#eb6834'), c3: v('--c3', '#1baf7a'), c4: v('--c4', '#eda100'), ink: v('--ink', '#0f172a'),
        muted: v('--muted', '#4b5768'), grid: v('--grid', '#e2e8f0'), axis: v('--muted', '#4b5768'), surface: v('--surface', '#fff') };
    };
    let last = '';
    const render = () => {
      const w = Math.max(240, Math.floor(canvas.clientWidth)), c = colors(), key = w + c.c1 + c.ink;
      if (key === last) return; last = key; canvas.innerHTML = draw[type](rows, w, c, f, card);
    };
    render();
    if ('ResizeObserver' in window) new ResizeObserver(render).observe(card);
    wrap.classList.add(HIDE);
    if (btn) {
      btn.hidden = false;
      btn.addEventListener('click', () => { const shown = !wrap.classList.toggle(HIDE); btn.textContent = shown ? 'Hide table' : 'Show table'; });
    }
  });
})();

Bootstrap 5 code

Requires: Bootstrap 5.3.8 CSS

HTML
<div class="row g-4 gy-5">
<div class="col-lg-6"><span class="lbl">Bar chart</span>
<article class="card cw" data-chart="bar" data-format="number"><div class="card-body d-flex flex-column gap-3">
  <div class="d-flex justify-content-between align-items-start gap-3"><div><h3 class="cw-title mb-0">Orders by weekday</h3><p class="cw-sub mb-0">Week of Oct 5, 2026 · 6,911 orders</p></div>
    <button type="button" class="btn btn-sm btn-outline-primary flex-shrink-0" data-chart-toggle aria-controls="cw-orders" hidden>Show table</button></div>
  <div class="cw-canvas" data-chart-canvas></div>
  <div class="table-responsive" id="cw-orders" data-chart-table>
    <table class="table table-sm mb-0 caption-top"><caption>Orders by weekday, week of Oct 5, 2026</caption>
      <thead><tr><th scope="col">Day</th><th scope="col" class="text-end">Orders</th></tr></thead>
      <tbody>
          <tr><th scope="row">Mon</th><td data-value="842">842</td></tr>
          <tr><th scope="row">Tue</th><td data-value="913">913</td></tr>
          <tr><th scope="row">Wed</th><td data-value="1027">1,027</td></tr>
          <tr><th scope="row">Thu</th><td data-value="968">968</td></tr>
          <tr><th scope="row">Fri</th><td data-value="1284">1,284</td></tr>
          <tr><th scope="row">Sat</th><td data-value="1146">1,146</td></tr>
          <tr><th scope="row">Sun</th><td data-value="731">731</td></tr>
      </tbody></table>
  </div>
</div></article></div>

<div class="col-lg-6"><span class="lbl">Donut chart with legend</span>
<article class="card cw" data-chart="donut" data-format="usd"><div class="card-body d-flex flex-column gap-3">
  <div class="d-flex justify-content-between align-items-start gap-3"><div><h3 class="cw-title mb-0">Revenue by channel</h3><p class="cw-sub mb-0">Q3 2026 · $480,000 total</p></div>
    <button type="button" class="btn btn-sm btn-outline-primary flex-shrink-0" data-chart-toggle aria-controls="cw-channels" hidden>Show table</button></div>
  <div class="d-flex flex-wrap align-items-center gap-4"><div class="cw-canvas flex-shrink-0" data-chart-canvas></div><ul class="cw-legend list-unstyled mb-0" data-chart-legend aria-hidden="true"></ul></div>
  <div class="table-responsive" id="cw-channels" data-chart-table>
    <table class="table table-sm mb-0 caption-top"><caption>Revenue by channel, Q3 2026</caption>
      <thead><tr><th scope="col">Channel</th><th scope="col" class="text-end">Revenue</th><th scope="col" class="text-end">Share</th></tr></thead>
      <tbody>
          <tr><th scope="row">Organic search</th><td data-value="182400">$182,400</td><td>38%</td></tr>
          <tr><th scope="row">Paid social</th><td data-value="115200">$115,200</td><td>24%</td></tr>
          <tr><th scope="row">Email</th><td data-value="96000">$96,000</td><td>20%</td></tr>
          <tr><th scope="row">Referral</th><td data-value="86400">$86,400</td><td>18%</td></tr>
      </tbody></table>
  </div>
</div></article></div>

<div class="col-12"><span class="lbl">Area chart</span>
<article class="card cw" data-chart="line" data-format="usd-compact"><div class="card-body d-flex flex-column gap-3">
  <div class="d-flex justify-content-between align-items-start gap-3"><div><h3 class="cw-title mb-0">Monthly recurring revenue</h3><p class="cw-sub mb-0">Jan–Oct 2026 · up 49.2% since January</p></div>
    <button type="button" class="btn btn-sm btn-outline-primary flex-shrink-0" data-chart-toggle aria-controls="cw-mrr" hidden>Show table</button></div>
  <div class="cw-canvas" data-chart-canvas></div>
  <div class="table-responsive" id="cw-mrr" data-chart-table>
    <table class="table table-sm mb-0 caption-top"><caption>Monthly recurring revenue, January to October 2026</caption>
      <thead><tr><th scope="col">Month</th><th scope="col" class="text-end">MRR</th></tr></thead>
      <tbody>
          <tr><th scope="row">Jan</th><td data-value="86410">$86,410</td></tr>
          <tr><th scope="row">Feb</th><td data-value="90120">$90,120</td></tr>
          <tr><th scope="row">Mar</th><td data-value="94730">$94,730</td></tr>
          <tr><th scope="row">Apr</th><td data-value="99050">$99,050</td></tr>
          <tr><th scope="row">May</th><td data-value="104200">$104,200</td></tr>
          <tr><th scope="row">Jun</th><td data-value="108870">$108,870</td></tr>
          <tr><th scope="row">Jul</th><td data-value="112640">$112,640</td></tr>
          <tr><th scope="row">Aug</th><td data-value="117420">$117,420</td></tr>
          <tr><th scope="row">Sep</th><td data-value="123860">$123,860</td></tr>
          <tr><th scope="row">Oct</th><td data-value="128940">$128,940</td></tr>
      </tbody></table>
  </div>
</div></article></div>
</div>
CSS
/* Bootstrap .card, .btn and .table; the script reads each table, draws the SVG chart and adds .visually-hidden to the table.
   Chart colours are custom properties on .cw, the rest are Bootstrap variables. */
.cw{--c1:#2a78d6;--c2:#eb6834;--c3:#1baf7a;--c4:#eda100;--ink:#0f172a;--muted:#4b5768;--grid:#e2e8f0;--surface:#fff;
  --bs-card-border-color:#e2e8f0;--bs-card-border-radius:16px;--bs-card-spacer-x:18px;--bs-card-spacer-y:18px;
  color:var(--ink);box-shadow:0 1px 2px rgba(15,23,42,.04),0 8px 24px rgba(15,23,42,.05);min-width:0}
.cw-title{font-size:1rem;font-weight:700}
.cw-sub{font-size:.8rem;color:var(--muted);font-variant-numeric:tabular-nums}
.cw .btn{--bs-btn-color:#1f5fae;--bs-btn-border-color:#9bb3cf;--bs-btn-hover-color:#1f5fae;--bs-btn-hover-bg:#eef4fb;--bs-btn-hover-border-color:#9bb3cf;
  --bs-btn-active-color:#1f5fae;--bs-btn-active-bg:#e2ecf8;--bs-btn-active-border-color:#9bb3cf;--bs-btn-font-size:.78rem;--bs-btn-font-weight:600;--bs-btn-border-radius:8px;--bs-btn-padding-y:5px;--bs-btn-padding-x:10px}
.cw .btn:focus-visible{outline:2px solid #1f5fae;outline-offset:2px;box-shadow:none}
.cw-canvas svg{display:block;width:100%;height:auto;overflow:visible}
.cw .flex-shrink-0.cw-canvas{flex-basis:170px;width:170px}
.cw-legend{flex:1 1 160px;display:grid;gap:8px;font-size:.84rem}
.cw-legend li{display:grid;grid-template-columns:12px 1fr auto auto;align-items:center;gap:8px;font-variant-numeric:tabular-nums}
.cw-legend i{width:12px;height:12px;border-radius:3px}
.cw-legend span:last-child{color:var(--muted);min-width:3ch;text-align:right}
.cw .table{--bs-table-color:var(--ink);--bs-table-border-color:var(--grid);font-size:.84rem;font-variant-numeric:tabular-nums}
.cw .table caption{font-size:.74rem;color:var(--muted);padding-top:0}
.cw .table thead th{font-size:.74rem;text-transform:uppercase;letter-spacing:.06em;color:var(--muted)}
.cw .table td{text-align:right}
.cw .table tbody th{font-weight:500}
JavaScript
// Draws each [data-chart] card from its own <table>: "bar", "line" (area) or "donut". No library.
// The table stays in the page for screen readers (visually hidden) and "Show table" puts it back on screen.
(() => {
  const HIDE = 'visually-hidden';
  const fmt = {
    number: new Intl.NumberFormat('en-US'),
    usd: new Intl.NumberFormat('en-US', { style: 'currency', currency: 'USD', maximumFractionDigits: 0 }),
    'usd-compact': new Intl.NumberFormat('en-US', { style: 'currency', currency: 'USD', notation: 'compact', maximumFractionDigits: 1 })
  };
  const r1 = n => Math.round(n * 10) / 10;
  const esc = s => s.replace(/[&<>"]/g, c => ({ '&': '&', '<': '<', '>': '>', '"': '"' })[c]);
  const niceStep = (range, steps) => { const raw = range / steps, mag = 10 ** Math.floor(Math.log10(raw || 1)); return [1, 2, 2.5, 5, 10].map(s => s * mag).find(s => s >= raw); };

  const draw = {
    bar(rows, w, c, f) {
      const h = 200, top = 22, base = h - 26, band = (w - 8) / rows.length, bw = Math.min(38, band * .62);
      const max = Math.max(...rows.map(r => r.value));
      let s = `<svg viewBox="0 0 ${w} ${h}" width="${w}" height="${h}" aria-hidden="true" focusable="false">`;
      rows.forEach((r, i) => {
        const x = 4 + band * i + (band - bw) / 2, y = base - (r.value / max) * (base - top), rr = Math.min(4, bw / 3);
        s += `<path fill="${c.c1}" d="M${r1(x)} ${base}V${r1(y + rr)}Q${r1(x)} ${r1(y)} ${r1(x + rr)} ${r1(y)}H${r1(x + bw - rr)}Q${r1(x + bw)} ${r1(y)} ${r1(x + bw)} ${r1(y + rr)}V${base}Z"><title>${esc(r.label)}: ${f.format(r.value)}</title></path>`;
        s += `<text x="${r1(x + bw / 2)}" y="${r1(y - 6)}" text-anchor="middle" font-size="11" font-weight="600" fill="${c.ink}">${f.format(r.value)}</text>`;
        s += `<text x="${r1(x + bw / 2)}" y="${h - 8}" text-anchor="middle" font-size="11" fill="${c.muted}">${esc(r.label)}</text>`;
      });
      return s + `<line x1="0" x2="${w}" y1="${base}" y2="${base}" stroke="${c.axis}" stroke-width="1"/></svg>`;
    },
    line(rows, w, c, f) {
      const h = 220, top = 18, base = h - 26, left = 46, right = w - 12, vals = rows.map(r => r.value);
      const step = niceStep(Math.max(...vals) - Math.min(...vals), 4);
      const lo = Math.floor(Math.min(...vals) / step) * step, hi = Math.ceil(Math.max(...vals) / step) * step;
      const x = i => left + i * (right - left) / (rows.length - 1), y = v => base - (v - lo) / (hi - lo) * (base - top);
      let s = `<svg viewBox="0 0 ${w} ${h}" width="${w}" height="${h}" aria-hidden="true" focusable="false">`;
      for (let v = lo; v <= hi + step / 2; v += step) s += `<line x1="${left}" x2="${right}" y1="${r1(y(v))}" y2="${r1(y(v))}" stroke="${v === lo ? c.axis : c.grid}" stroke-width="1"/><text x="${left - 8}" y="${r1(y(v) + 4)}" text-anchor="end" font-size="11" fill="${c.muted}">${f.format(v)}</text>`;
      const every = (right - left) / rows.length < 34 ? 2 : 1;
      const pts = rows.map((r, i) => [r1(x(i)), r1(y(r.value))]);
      const d = pts.map((p, i) => `${i ? 'L' : 'M'}${p[0]} ${p[1]}`).join('');
      s += `<path d="${d}L${pts.at(-1)[0]} ${base}L${pts[0][0]} ${base}Z" fill="${c.c1}" fill-opacity=".12"/>`;
      s += `<path d="${d}" fill="none" stroke="${c.c1}" stroke-width="2" stroke-linejoin="round" stroke-linecap="round"/>`;
      rows.forEach((r, i) => {
        if ((rows.length - 1 - i) % every === 0) s += `<text x="${pts[i][0]}" y="${h - 8}" text-anchor="middle" font-size="11" fill="${c.muted}">${esc(r.label)}</text>`;
        s += `<circle cx="${pts[i][0]}" cy="${pts[i][1]}" r="${i === rows.length - 1 ? 5 : 3.5}" fill="${c.c1}" stroke="${c.surface}" stroke-width="2"><title>${esc(r.label)}: ${esc(r.text)}</title></circle>`;
      });
      const last = pts.at(-1);
      return s + `<text x="${last[0] - 10}" y="${last[1] - 12}" text-anchor="end" font-size="12" font-weight="700" fill="${c.ink}">${f.format(vals.at(-1))}</text></svg>`;
    },
    donut(rows, w, c, f, card) {
      const total = rows.reduce((a, r) => a + r.value, 0), cols = [c.c1, c.c2, c.c3, c.c4];
      let s = '<svg viewBox="0 0 170 170" width="170" height="170" aria-hidden="true" focusable="false"><g transform="rotate(-90 85 85)">', at = 0;
      rows.forEach((r, i) => {
        const p = r.value / total * 100;
        s += `<circle cx="85" cy="85" r="64" fill="none" stroke="${cols[i % 4]}" stroke-width="26" pathLength="100" stroke-dasharray="${r1(p - .8)} ${r1(100 - p + .8)}" stroke-dashoffset="${r1(-at)}"><title>${esc(r.label)}: ${esc(r.text)}</title></circle>`;
        at += p;
      });
      s += `</g><text x="85" y="84" text-anchor="middle" font-size="20" font-weight="750" fill="${c.ink}">${new Intl.NumberFormat('en-US', { style: 'currency', currency: 'USD', notation: 'compact' }).format(total)}</text><text x="85" y="103" text-anchor="middle" font-size="11" fill="${c.muted}">total</text></svg>`;
      const legend = card.querySelector('[data-chart-legend]');
      if (legend) legend.innerHTML = rows.map((r, i) => `<li><i style="background:${cols[i % 4]}"></i><span>${esc(r.label)}</span><b>${esc(r.text)}</b><span>${Math.round(r.value / total * 100)}%</span></li>`).join('');
      return s;
    }
  };

  document.querySelectorAll('[data-chart]').forEach(card => {
    const type = card.dataset.chart, canvas = card.querySelector('[data-chart-canvas]'), wrap = card.querySelector('[data-chart-table]');
    const btn = card.querySelector('[data-chart-toggle]'), table = wrap && wrap.querySelector('table');
    if (!draw[type] || !canvas || !table) return;
    const rows = [...table.tBodies[0].rows].map(tr => ({ label: tr.cells[0].textContent.trim(), value: parseFloat(tr.cells[1].dataset.value), text: tr.cells[1].textContent.trim() }));
    const f = fmt[card.dataset.format] || fmt.number;
    const colors = () => {
      const css = getComputedStyle(card), v = (n, d) => css.getPropertyValue(n).trim() || d;
      return { c1: v('--c1', '#2a78d6'), c2: v('--c2', '#eb6834'), c3: v('--c3', '#1baf7a'), c4: v('--c4', '#eda100'), ink: v('--ink', '#0f172a'),
        muted: v('--muted', '#4b5768'), grid: v('--grid', '#e2e8f0'), axis: v('--muted', '#4b5768'), surface: v('--surface', '#fff') };
    };
    let last = '';
    const render = () => {
      const w = Math.max(240, Math.floor(canvas.clientWidth)), c = colors(), key = w + c.c1 + c.ink;
      if (key === last) return; last = key; canvas.innerHTML = draw[type](rows, w, c, f, card);
    };
    render();
    if ('ResizeObserver' in window) new ResizeObserver(render).observe(card);
    wrap.classList.add(HIDE);
    if (btn) {
      btn.hidden = false;
      btn.addEventListener('click', () => { const shown = !wrap.classList.toggle(HIDE); btn.textContent = shown ? 'Hide table' : 'Show table'; });
    }
  });
})();

Tailwind 4 code

Requires: Tailwind CSS 4

HTML
<div class="grid grid-cols-[repeat(auto-fit,minmax(min(100%,380px),1fr))] gap-x-[18px] gap-y-9">
<div><span class="mb-4 block text-[.72rem] tracking-[.12em] text-[#4b5768] uppercase">Bar chart</span>
<article class="flex min-w-0 flex-col gap-3 rounded-2xl border border-[#e2e8f0] bg-white px-[18px] pt-[18px] pb-4 text-[#0f172a] shadow-[0_1px_2px_rgba(15,23,42,.04),0_8px_24px_rgba(15,23,42,.05)] [--c1:#2a78d6] [--c2:#eb6834] [--c3:#1baf7a] [--c4:#eda100] [--ink:#0f172a] [--muted:#4b5768] [--grid:#e2e8f0] [--surface:#fff]" data-chart="bar" data-format="number">
  <div class="flex items-start justify-between gap-3"><div><h3 class="text-base font-bold">Orders by weekday</h3><p class="text-[.8rem] text-[#4b5768] tabular-nums">Week of Oct 5, 2026 · 6,911 orders</p></div>
    <button type="button" class="flex-none cursor-pointer rounded-lg border border-[#9bb3cf] bg-white px-2.5 py-[5px] text-[.78rem] font-semibold text-[#1f5fae] transition-colors hover:bg-[#eef4fb] focus-visible:outline-2 focus-visible:outline-offset-2 focus-visible:outline-[#1f5fae] motion-reduce:transition-none" data-chart-toggle aria-controls="cw-orders" hidden>Show table</button></div>
  <div class="[&_svg]:block [&_svg]:h-auto [&_svg]:w-full [&_svg]:overflow-visible" data-chart-canvas></div>
  <div id="cw-orders" data-chart-table>
    <table class="w-full border-collapse text-[.84rem] tabular-nums"><caption class="pb-1.5 text-left text-[.74rem] text-[#4b5768]">Orders by weekday, week of Oct 5, 2026</caption>
      <thead><tr><th scope="col" class="border-b border-[#e2e8f0] px-2 py-1.5 text-[.74rem] font-semibold tracking-[.06em] text-[#4b5768] uppercase text-left">Day</th><th scope="col" class="border-b border-[#e2e8f0] px-2 py-1.5 text-[.74rem] font-semibold tracking-[.06em] text-[#4b5768] uppercase text-right">Orders</th></tr></thead>
      <tbody>
          <tr><th scope="row" class="border-b border-[#e2e8f0] px-2 py-1.5 text-left font-medium">Mon</th><td class="border-b border-[#e2e8f0] px-2 py-1.5 text-right" data-value="842">842</td></tr>
          <tr><th scope="row" class="border-b border-[#e2e8f0] px-2 py-1.5 text-left font-medium">Tue</th><td class="border-b border-[#e2e8f0] px-2 py-1.5 text-right" data-value="913">913</td></tr>
          <tr><th scope="row" class="border-b border-[#e2e8f0] px-2 py-1.5 text-left font-medium">Wed</th><td class="border-b border-[#e2e8f0] px-2 py-1.5 text-right" data-value="1027">1,027</td></tr>
          <tr><th scope="row" class="border-b border-[#e2e8f0] px-2 py-1.5 text-left font-medium">Thu</th><td class="border-b border-[#e2e8f0] px-2 py-1.5 text-right" data-value="968">968</td></tr>
          <tr><th scope="row" class="border-b border-[#e2e8f0] px-2 py-1.5 text-left font-medium">Fri</th><td class="border-b border-[#e2e8f0] px-2 py-1.5 text-right" data-value="1284">1,284</td></tr>
          <tr><th scope="row" class="border-b border-[#e2e8f0] px-2 py-1.5 text-left font-medium">Sat</th><td class="border-b border-[#e2e8f0] px-2 py-1.5 text-right" data-value="1146">1,146</td></tr>
          <tr><th scope="row" class="border-b border-[#e2e8f0] px-2 py-1.5 text-left font-medium">Sun</th><td class="border-b border-[#e2e8f0] px-2 py-1.5 text-right" data-value="731">731</td></tr>
      </tbody></table>
  </div>
</article></div>

<div><span class="mb-4 block text-[.72rem] tracking-[.12em] text-[#4b5768] uppercase">Donut chart with legend</span>
<article class="flex min-w-0 flex-col gap-3 rounded-2xl border border-[#e2e8f0] bg-white px-[18px] pt-[18px] pb-4 text-[#0f172a] shadow-[0_1px_2px_rgba(15,23,42,.04),0_8px_24px_rgba(15,23,42,.05)] [--c1:#2a78d6] [--c2:#eb6834] [--c3:#1baf7a] [--c4:#eda100] [--ink:#0f172a] [--muted:#4b5768] [--grid:#e2e8f0] [--surface:#fff]" data-chart="donut" data-format="usd">
  <div class="flex items-start justify-between gap-3"><div><h3 class="text-base font-bold">Revenue by channel</h3><p class="text-[.8rem] text-[#4b5768] tabular-nums">Q3 2026 · $480,000 total</p></div>
    <button type="button" class="flex-none cursor-pointer rounded-lg border border-[#9bb3cf] bg-white px-2.5 py-[5px] text-[.78rem] font-semibold text-[#1f5fae] transition-colors hover:bg-[#eef4fb] focus-visible:outline-2 focus-visible:outline-offset-2 focus-visible:outline-[#1f5fae] motion-reduce:transition-none" data-chart-toggle aria-controls="cw-channels" hidden>Show table</button></div>
  <div class="flex flex-wrap items-center gap-[22px]"><div class="flex-[0_0_170px] [&_svg]:block [&_svg]:h-auto [&_svg]:w-full [&_svg]:overflow-visible" data-chart-canvas></div><ul class="grid flex-[1_1_160px] gap-2 text-[.84rem] [&_b]:font-bold [&_i]:size-3 [&_i]:rounded-[3px] [&_li]:grid [&_li]:grid-cols-[12px_1fr_auto_auto] [&_li]:items-center [&_li]:gap-2 [&_li]:tabular-nums [&_li>span:last-child]:min-w-[3ch] [&_li>span:last-child]:text-right [&_li>span:last-child]:text-[#4b5768]" data-chart-legend aria-hidden="true"></ul></div>
  <div id="cw-channels" data-chart-table>
    <table class="w-full border-collapse text-[.84rem] tabular-nums"><caption class="pb-1.5 text-left text-[.74rem] text-[#4b5768]">Revenue by channel, Q3 2026</caption>
      <thead><tr><th scope="col" class="border-b border-[#e2e8f0] px-2 py-1.5 text-[.74rem] font-semibold tracking-[.06em] text-[#4b5768] uppercase text-left">Channel</th><th scope="col" class="border-b border-[#e2e8f0] px-2 py-1.5 text-[.74rem] font-semibold tracking-[.06em] text-[#4b5768] uppercase text-right">Revenue</th><th scope="col" class="border-b border-[#e2e8f0] px-2 py-1.5 text-[.74rem] font-semibold tracking-[.06em] text-[#4b5768] uppercase text-right">Share</th></tr></thead>
      <tbody>
          <tr><th scope="row" class="border-b border-[#e2e8f0] px-2 py-1.5 text-left font-medium">Organic search</th><td class="border-b border-[#e2e8f0] px-2 py-1.5 text-right" data-value="182400">$182,400</td><td class="border-b border-[#e2e8f0] px-2 py-1.5 text-right">38%</td></tr>
          <tr><th scope="row" class="border-b border-[#e2e8f0] px-2 py-1.5 text-left font-medium">Paid social</th><td class="border-b border-[#e2e8f0] px-2 py-1.5 text-right" data-value="115200">$115,200</td><td class="border-b border-[#e2e8f0] px-2 py-1.5 text-right">24%</td></tr>
          <tr><th scope="row" class="border-b border-[#e2e8f0] px-2 py-1.5 text-left font-medium">Email</th><td class="border-b border-[#e2e8f0] px-2 py-1.5 text-right" data-value="96000">$96,000</td><td class="border-b border-[#e2e8f0] px-2 py-1.5 text-right">20%</td></tr>
          <tr><th scope="row" class="border-b border-[#e2e8f0] px-2 py-1.5 text-left font-medium">Referral</th><td class="border-b border-[#e2e8f0] px-2 py-1.5 text-right" data-value="86400">$86,400</td><td class="border-b border-[#e2e8f0] px-2 py-1.5 text-right">18%</td></tr>
      </tbody></table>
  </div>
</article></div>

<div class="col-span-full"><span class="mb-4 block text-[.72rem] tracking-[.12em] text-[#4b5768] uppercase">Area chart</span>
<article class="flex min-w-0 flex-col gap-3 rounded-2xl border border-[#e2e8f0] bg-white px-[18px] pt-[18px] pb-4 text-[#0f172a] shadow-[0_1px_2px_rgba(15,23,42,.04),0_8px_24px_rgba(15,23,42,.05)] [--c1:#2a78d6] [--c2:#eb6834] [--c3:#1baf7a] [--c4:#eda100] [--ink:#0f172a] [--muted:#4b5768] [--grid:#e2e8f0] [--surface:#fff]" data-chart="line" data-format="usd-compact">
  <div class="flex items-start justify-between gap-3"><div><h3 class="text-base font-bold">Monthly recurring revenue</h3><p class="text-[.8rem] text-[#4b5768] tabular-nums">Jan–Oct 2026 · up 49.2% since January</p></div>
    <button type="button" class="flex-none cursor-pointer rounded-lg border border-[#9bb3cf] bg-white px-2.5 py-[5px] text-[.78rem] font-semibold text-[#1f5fae] transition-colors hover:bg-[#eef4fb] focus-visible:outline-2 focus-visible:outline-offset-2 focus-visible:outline-[#1f5fae] motion-reduce:transition-none" data-chart-toggle aria-controls="cw-mrr" hidden>Show table</button></div>
  <div class="[&_svg]:block [&_svg]:h-auto [&_svg]:w-full [&_svg]:overflow-visible" data-chart-canvas></div>
  <div id="cw-mrr" data-chart-table>
    <table class="w-full border-collapse text-[.84rem] tabular-nums"><caption class="pb-1.5 text-left text-[.74rem] text-[#4b5768]">Monthly recurring revenue, January to October 2026</caption>
      <thead><tr><th scope="col" class="border-b border-[#e2e8f0] px-2 py-1.5 text-[.74rem] font-semibold tracking-[.06em] text-[#4b5768] uppercase text-left">Month</th><th scope="col" class="border-b border-[#e2e8f0] px-2 py-1.5 text-[.74rem] font-semibold tracking-[.06em] text-[#4b5768] uppercase text-right">MRR</th></tr></thead>
      <tbody>
          <tr><th scope="row" class="border-b border-[#e2e8f0] px-2 py-1.5 text-left font-medium">Jan</th><td class="border-b border-[#e2e8f0] px-2 py-1.5 text-right" data-value="86410">$86,410</td></tr>
          <tr><th scope="row" class="border-b border-[#e2e8f0] px-2 py-1.5 text-left font-medium">Feb</th><td class="border-b border-[#e2e8f0] px-2 py-1.5 text-right" data-value="90120">$90,120</td></tr>
          <tr><th scope="row" class="border-b border-[#e2e8f0] px-2 py-1.5 text-left font-medium">Mar</th><td class="border-b border-[#e2e8f0] px-2 py-1.5 text-right" data-value="94730">$94,730</td></tr>
          <tr><th scope="row" class="border-b border-[#e2e8f0] px-2 py-1.5 text-left font-medium">Apr</th><td class="border-b border-[#e2e8f0] px-2 py-1.5 text-right" data-value="99050">$99,050</td></tr>
          <tr><th scope="row" class="border-b border-[#e2e8f0] px-2 py-1.5 text-left font-medium">May</th><td class="border-b border-[#e2e8f0] px-2 py-1.5 text-right" data-value="104200">$104,200</td></tr>
          <tr><th scope="row" class="border-b border-[#e2e8f0] px-2 py-1.5 text-left font-medium">Jun</th><td class="border-b border-[#e2e8f0] px-2 py-1.5 text-right" data-value="108870">$108,870</td></tr>
          <tr><th scope="row" class="border-b border-[#e2e8f0] px-2 py-1.5 text-left font-medium">Jul</th><td class="border-b border-[#e2e8f0] px-2 py-1.5 text-right" data-value="112640">$112,640</td></tr>
          <tr><th scope="row" class="border-b border-[#e2e8f0] px-2 py-1.5 text-left font-medium">Aug</th><td class="border-b border-[#e2e8f0] px-2 py-1.5 text-right" data-value="117420">$117,420</td></tr>
          <tr><th scope="row" class="border-b border-[#e2e8f0] px-2 py-1.5 text-left font-medium">Sep</th><td class="border-b border-[#e2e8f0] px-2 py-1.5 text-right" data-value="123860">$123,860</td></tr>
          <tr><th scope="row" class="border-b border-[#e2e8f0] px-2 py-1.5 text-left font-medium">Oct</th><td class="border-b border-[#e2e8f0] px-2 py-1.5 text-right" data-value="128940">$128,940</td></tr>
      </tbody></table>
  </div>
</article></div>
</div>
JavaScript
// Draws each [data-chart] card from its own <table>: "bar", "line" (area) or "donut". No library.
// The table stays in the page for screen readers (visually hidden) and "Show table" puts it back on screen.
(() => {
  const HIDE = 'sr-only';
  const fmt = {
    number: new Intl.NumberFormat('en-US'),
    usd: new Intl.NumberFormat('en-US', { style: 'currency', currency: 'USD', maximumFractionDigits: 0 }),
    'usd-compact': new Intl.NumberFormat('en-US', { style: 'currency', currency: 'USD', notation: 'compact', maximumFractionDigits: 1 })
  };
  const r1 = n => Math.round(n * 10) / 10;
  const esc = s => s.replace(/[&<>"]/g, c => ({ '&': '&', '<': '<', '>': '>', '"': '"' })[c]);
  const niceStep = (range, steps) => { const raw = range / steps, mag = 10 ** Math.floor(Math.log10(raw || 1)); return [1, 2, 2.5, 5, 10].map(s => s * mag).find(s => s >= raw); };

  const draw = {
    bar(rows, w, c, f) {
      const h = 200, top = 22, base = h - 26, band = (w - 8) / rows.length, bw = Math.min(38, band * .62);
      const max = Math.max(...rows.map(r => r.value));
      let s = `<svg viewBox="0 0 ${w} ${h}" width="${w}" height="${h}" aria-hidden="true" focusable="false">`;
      rows.forEach((r, i) => {
        const x = 4 + band * i + (band - bw) / 2, y = base - (r.value / max) * (base - top), rr = Math.min(4, bw / 3);
        s += `<path fill="${c.c1}" d="M${r1(x)} ${base}V${r1(y + rr)}Q${r1(x)} ${r1(y)} ${r1(x + rr)} ${r1(y)}H${r1(x + bw - rr)}Q${r1(x + bw)} ${r1(y)} ${r1(x + bw)} ${r1(y + rr)}V${base}Z"><title>${esc(r.label)}: ${f.format(r.value)}</title></path>`;
        s += `<text x="${r1(x + bw / 2)}" y="${r1(y - 6)}" text-anchor="middle" font-size="11" font-weight="600" fill="${c.ink}">${f.format(r.value)}</text>`;
        s += `<text x="${r1(x + bw / 2)}" y="${h - 8}" text-anchor="middle" font-size="11" fill="${c.muted}">${esc(r.label)}</text>`;
      });
      return s + `<line x1="0" x2="${w}" y1="${base}" y2="${base}" stroke="${c.axis}" stroke-width="1"/></svg>`;
    },
    line(rows, w, c, f) {
      const h = 220, top = 18, base = h - 26, left = 46, right = w - 12, vals = rows.map(r => r.value);
      const step = niceStep(Math.max(...vals) - Math.min(...vals), 4);
      const lo = Math.floor(Math.min(...vals) / step) * step, hi = Math.ceil(Math.max(...vals) / step) * step;
      const x = i => left + i * (right - left) / (rows.length - 1), y = v => base - (v - lo) / (hi - lo) * (base - top);
      let s = `<svg viewBox="0 0 ${w} ${h}" width="${w}" height="${h}" aria-hidden="true" focusable="false">`;
      for (let v = lo; v <= hi + step / 2; v += step) s += `<line x1="${left}" x2="${right}" y1="${r1(y(v))}" y2="${r1(y(v))}" stroke="${v === lo ? c.axis : c.grid}" stroke-width="1"/><text x="${left - 8}" y="${r1(y(v) + 4)}" text-anchor="end" font-size="11" fill="${c.muted}">${f.format(v)}</text>`;
      const every = (right - left) / rows.length < 34 ? 2 : 1;
      const pts = rows.map((r, i) => [r1(x(i)), r1(y(r.value))]);
      const d = pts.map((p, i) => `${i ? 'L' : 'M'}${p[0]} ${p[1]}`).join('');
      s += `<path d="${d}L${pts.at(-1)[0]} ${base}L${pts[0][0]} ${base}Z" fill="${c.c1}" fill-opacity=".12"/>`;
      s += `<path d="${d}" fill="none" stroke="${c.c1}" stroke-width="2" stroke-linejoin="round" stroke-linecap="round"/>`;
      rows.forEach((r, i) => {
        if ((rows.length - 1 - i) % every === 0) s += `<text x="${pts[i][0]}" y="${h - 8}" text-anchor="middle" font-size="11" fill="${c.muted}">${esc(r.label)}</text>`;
        s += `<circle cx="${pts[i][0]}" cy="${pts[i][1]}" r="${i === rows.length - 1 ? 5 : 3.5}" fill="${c.c1}" stroke="${c.surface}" stroke-width="2"><title>${esc(r.label)}: ${esc(r.text)}</title></circle>`;
      });
      const last = pts.at(-1);
      return s + `<text x="${last[0] - 10}" y="${last[1] - 12}" text-anchor="end" font-size="12" font-weight="700" fill="${c.ink}">${f.format(vals.at(-1))}</text></svg>`;
    },
    donut(rows, w, c, f, card) {
      const total = rows.reduce((a, r) => a + r.value, 0), cols = [c.c1, c.c2, c.c3, c.c4];
      let s = '<svg viewBox="0 0 170 170" width="170" height="170" aria-hidden="true" focusable="false"><g transform="rotate(-90 85 85)">', at = 0;
      rows.forEach((r, i) => {
        const p = r.value / total * 100;
        s += `<circle cx="85" cy="85" r="64" fill="none" stroke="${cols[i % 4]}" stroke-width="26" pathLength="100" stroke-dasharray="${r1(p - .8)} ${r1(100 - p + .8)}" stroke-dashoffset="${r1(-at)}"><title>${esc(r.label)}: ${esc(r.text)}</title></circle>`;
        at += p;
      });
      s += `</g><text x="85" y="84" text-anchor="middle" font-size="20" font-weight="750" fill="${c.ink}">${new Intl.NumberFormat('en-US', { style: 'currency', currency: 'USD', notation: 'compact' }).format(total)}</text><text x="85" y="103" text-anchor="middle" font-size="11" fill="${c.muted}">total</text></svg>`;
      const legend = card.querySelector('[data-chart-legend]');
      if (legend) legend.innerHTML = rows.map((r, i) => `<li><i style="background:${cols[i % 4]}"></i><span>${esc(r.label)}</span><b>${esc(r.text)}</b><span>${Math.round(r.value / total * 100)}%</span></li>`).join('');
      return s;
    }
  };

  document.querySelectorAll('[data-chart]').forEach(card => {
    const type = card.dataset.chart, canvas = card.querySelector('[data-chart-canvas]'), wrap = card.querySelector('[data-chart-table]');
    const btn = card.querySelector('[data-chart-toggle]'), table = wrap && wrap.querySelector('table');
    if (!draw[type] || !canvas || !table) return;
    const rows = [...table.tBodies[0].rows].map(tr => ({ label: tr.cells[0].textContent.trim(), value: parseFloat(tr.cells[1].dataset.value), text: tr.cells[1].textContent.trim() }));
    const f = fmt[card.dataset.format] || fmt.number;
    const colors = () => {
      const css = getComputedStyle(card), v = (n, d) => css.getPropertyValue(n).trim() || d;
      return { c1: v('--c1', '#2a78d6'), c2: v('--c2', '#eb6834'), c3: v('--c3', '#1baf7a'), c4: v('--c4', '#eda100'), ink: v('--ink', '#0f172a'),
        muted: v('--muted', '#4b5768'), grid: v('--grid', '#e2e8f0'), axis: v('--muted', '#4b5768'), surface: v('--surface', '#fff') };
    };
    let last = '';
    const render = () => {
      const w = Math.max(240, Math.floor(canvas.clientWidth)), c = colors(), key = w + c.c1 + c.ink;
      if (key === last) return; last = key; canvas.innerHTML = draw[type](rows, w, c, f, card);
    };
    render();
    if ('ResizeObserver' in window) new ResizeObserver(render).observe(card);
    wrap.classList.add(HIDE);
    if (btn) {
      btn.hidden = false;
      btn.addEventListener('click', () => { const shown = !wrap.classList.toggle(HIDE); btn.textContent = shown ? 'Hide table' : 'Show table'; });
    }
  });
})();

About this set

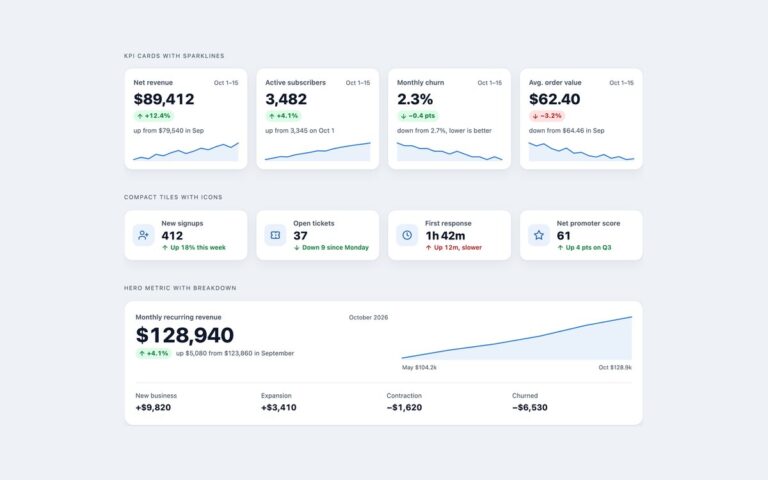
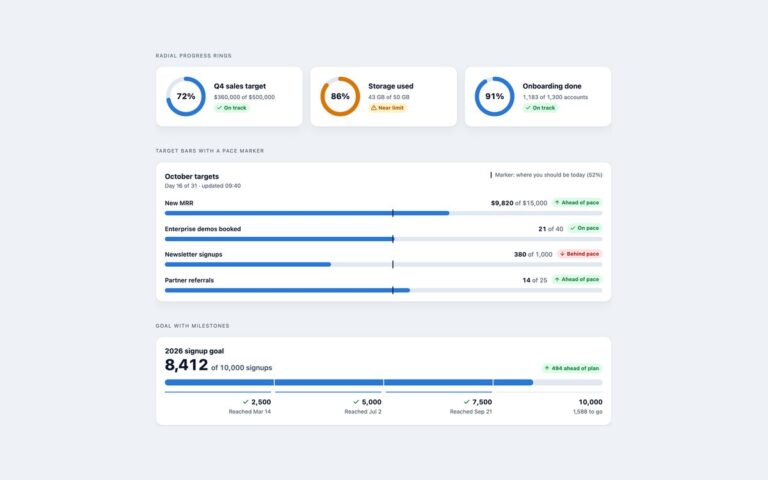
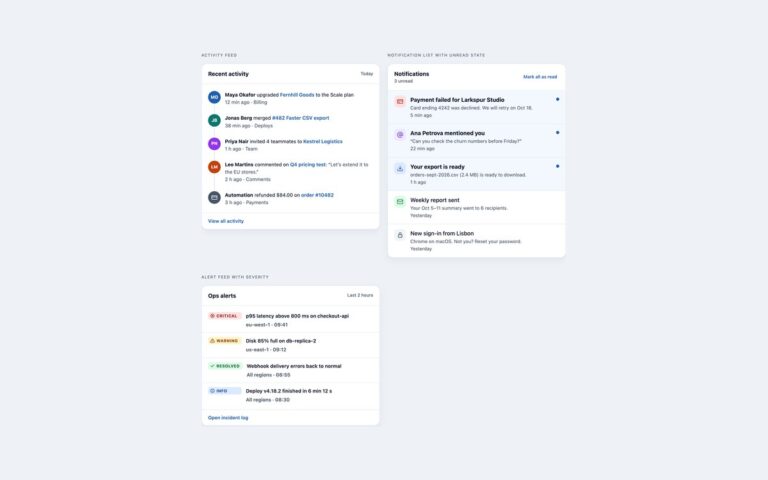
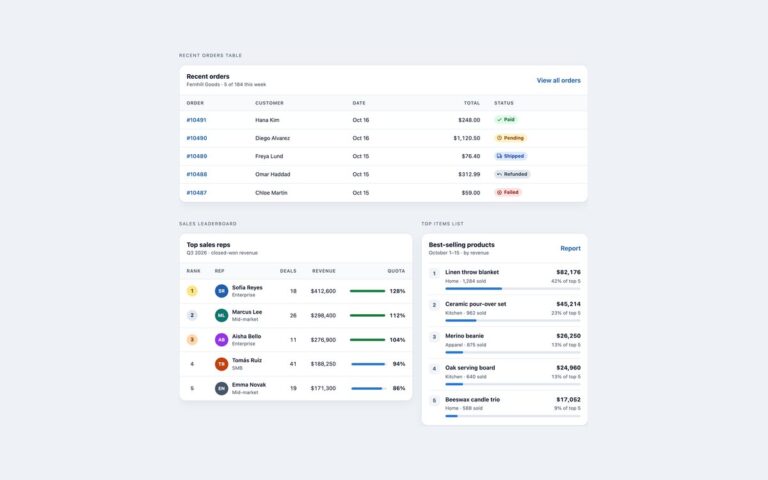
Three chart cards drawn as inline SVG by under ninety lines of vanilla JavaScript, with no chart library. The bar chart shows orders by weekday with the value printed above each bar. The donut chart splits quarterly revenue by channel into four segments with a small gap between them, a total in the middle and a legend that repeats each value and share. The area chart tracks monthly recurring revenue across ten months with a light grid, compact dollar ticks and the latest value labelled. Every card holds a real data table, and the script reads that table to draw its chart, so the numbers live in one place. Once the chart is drawn the table is hidden visually but stays readable by screen readers, and a Show table button puts it back on screen for anyone who prefers the figures. If the script does not run, the table is simply shown. Charts redraw at the card’s real width through ResizeObserver, so text stays crisp from a phone to a wide screen, and each mark carries a native SVG title as a hover tooltip. Colours come from custom properties on the card.

What’s included

  • Bar, donut and area charts drawn from small data tables
  • No chart library: under ninety lines of vanilla JavaScript
  • Data table stays available to screen readers, with a Show table button
  • Table shows on its own when JavaScript is off
  • Redraws at the real card width so labels never shrink
  • Values printed on the bars, in the legend and on the last point

Accessibility

The SVG charts are hidden from assistive technology and the same numbers are in a captioned table with column and row headers, visually hidden but always present. The Show table button has visible text that changes to Hide table and a visible focus outline. The donut legend prints every value and share, so no series is identified by colour alone.

Customise it

Set --c1 to --c4 for the series colours and --ink, --muted and --grid for text and gridlines on .cw (Tailwind: the [--c1:...] properties on the card). Change data-format on a card to number, usd or usd-compact to switch the value formatting.