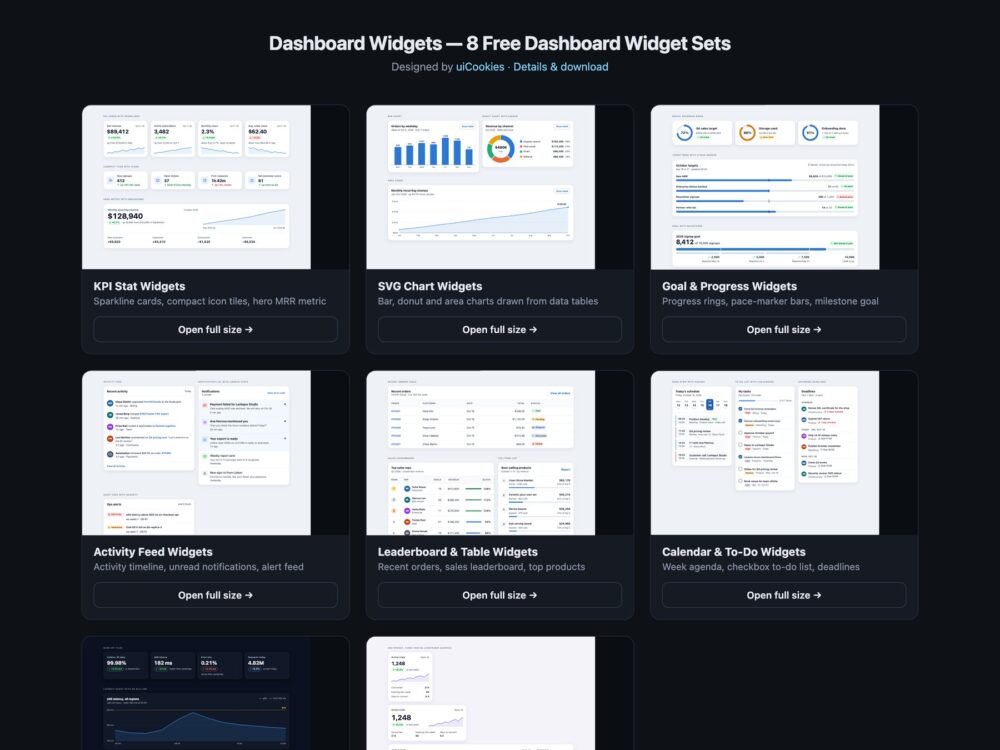
Dashboard Widgets is a pack of eight sets of admin dashboard widgets, designed and maintained in-house by uiCookies, with no chart library in any of them. Every set comes in three versions that look the same: plain HTML and CSS, Bootstrap 5 using .card, .table, .progress, .list-group, .badge and .form-check where they fit, and Tailwind CSS 4. The sets cover KPI stat cards with sparklines, bar, donut and area chart cards, progress rings and goal bars, activity and notification feeds, leaderboards and mini tables, calendar and to-do widgets, a dark ops dashboard and a modern-CSS set built on container queries, subgrid and a conic-gradient donut.
A good dashboard widget answers one question at a glance and still makes sense to someone who cannot see its colours. A change in a KPI card should carry a signed number, an arrow and a word such as up or lower is better, not just turn green or red, and a status should be a word with an icon. A chart needs its numbers somewhere a screen reader can reach, ideally a real data table that sighted users can open too. Numbers should be formatted the same way everywhere, right-aligned in tables and set in tabular figures so columns line up. And a widget should fit the column it lands in, which is what container queries are for.
Free download Browse live demos All snippets
The sets
1. KPI Stat Widgets
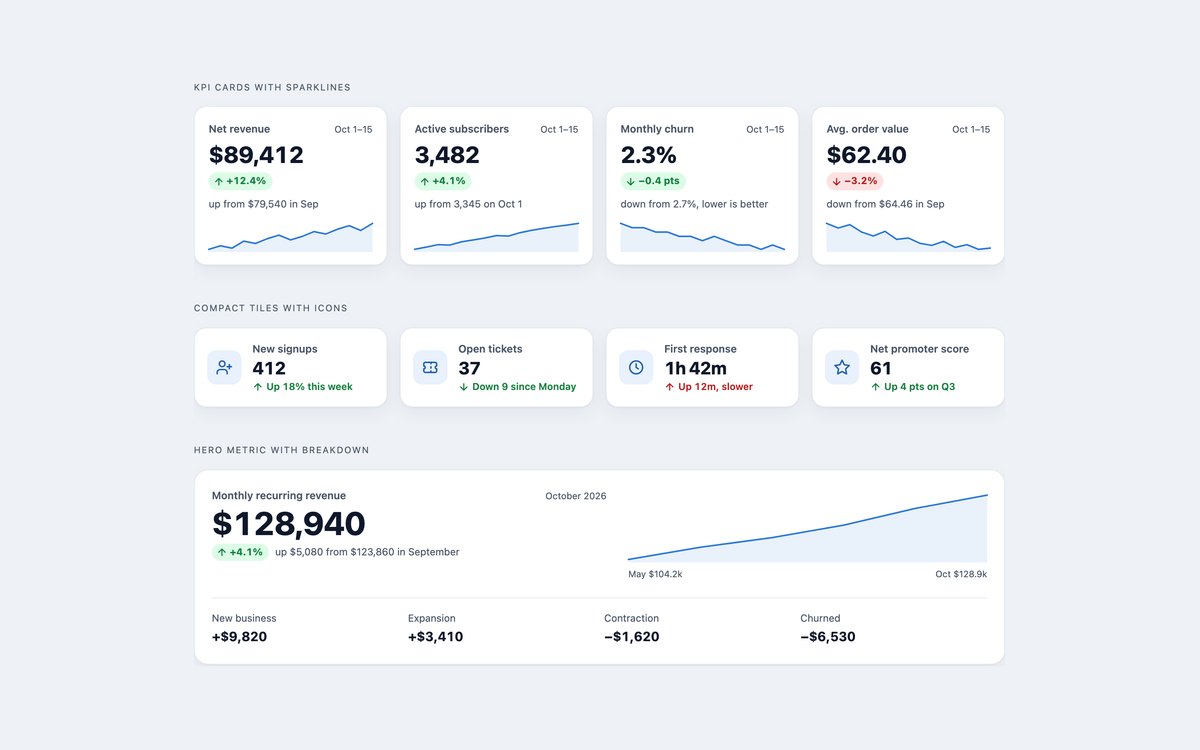
Four KPI cards with signed deltas and area sparklines, compact stat tiles with icons, and a full-width monthly recurring revenue card with a four-way breakdown.
Use them for the top row of any admin page. Every delta says up or down in words as well as with an arrow and colour, and the sparklines are plain inline SVG.
Live Demo CSS, Bootstrap & Tailwind code
2. SVG Chart Widgets
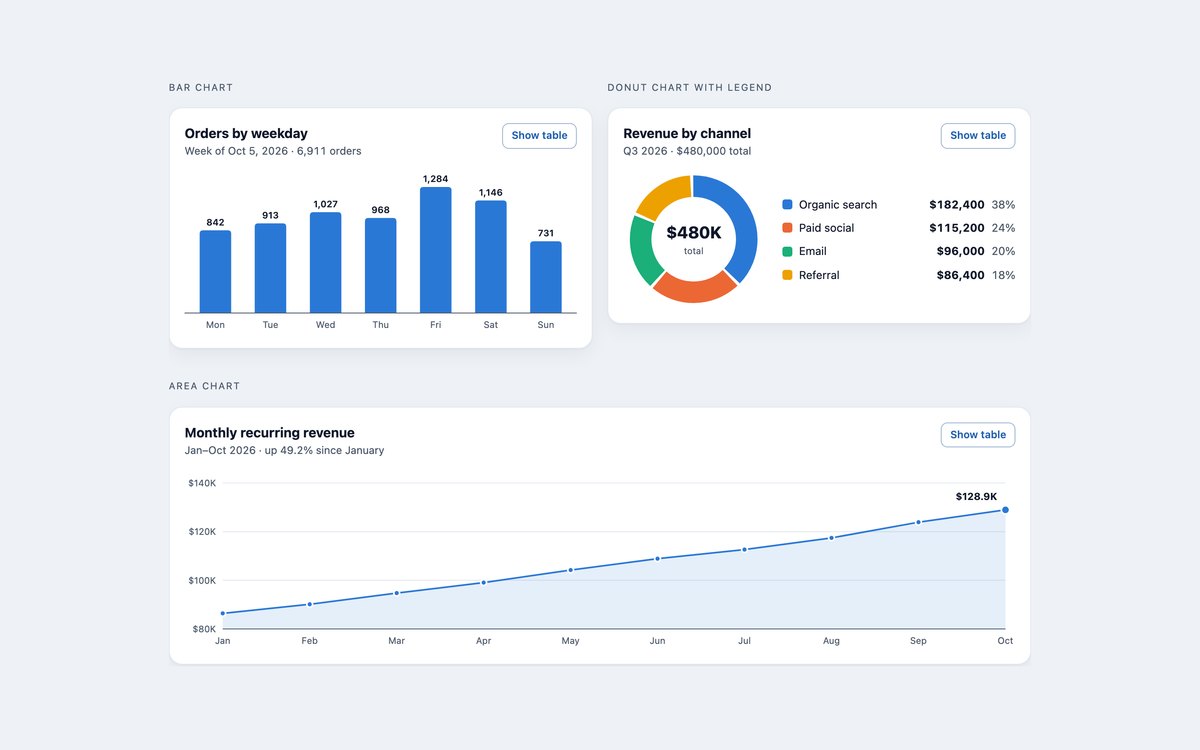
Bar, donut and area chart cards drawn as inline SVG from small data tables, with values printed on the chart and a legend for the donut.
A short vanilla script reads each card’s table, draws the chart at the card’s real width and hides the table visually; a Show table button brings it back, and without JavaScript the table is shown.
Live Demo CSS, Bootstrap & Tailwind code
3. Goal & Progress Widgets
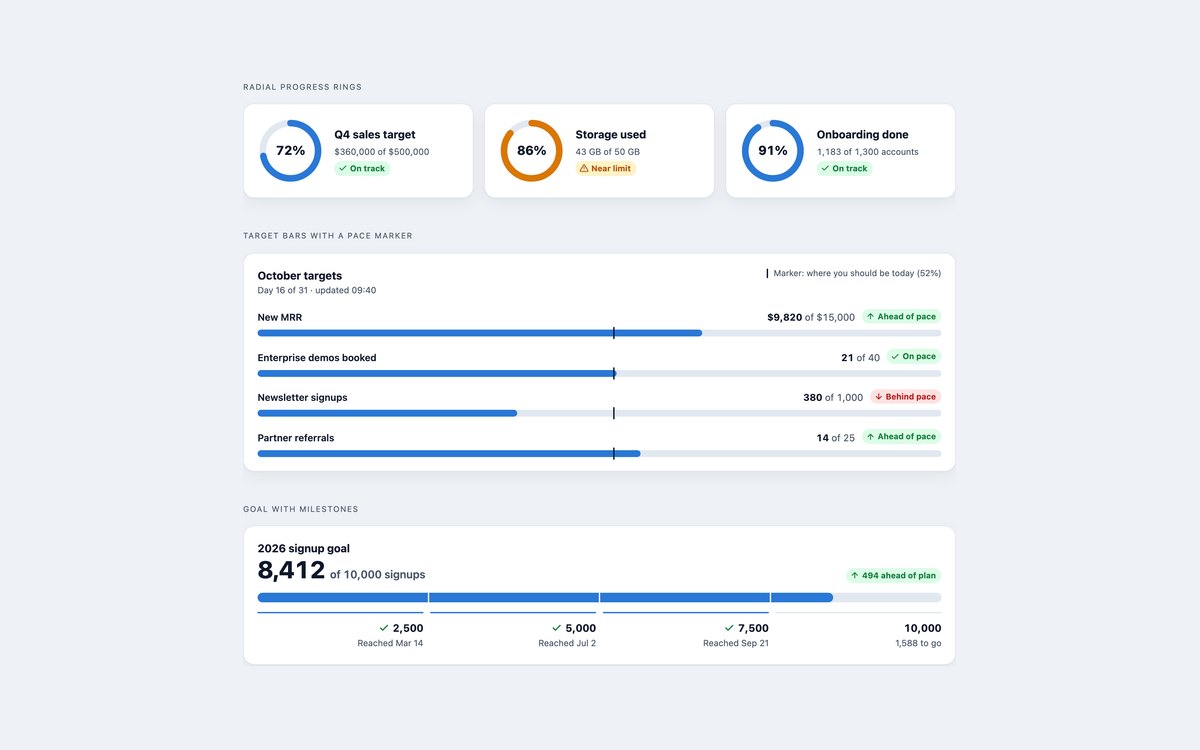
SVG progress rings for headline targets, target bars with a marker for expected pace, and an annual goal on a native progress element with milestones.
Every ring and bar is a named progressbar with a value text, and status badges such as On track or Behind pace pair a word with an icon.
Live Demo CSS, Bootstrap & Tailwind code
4. Activity Feed Widgets
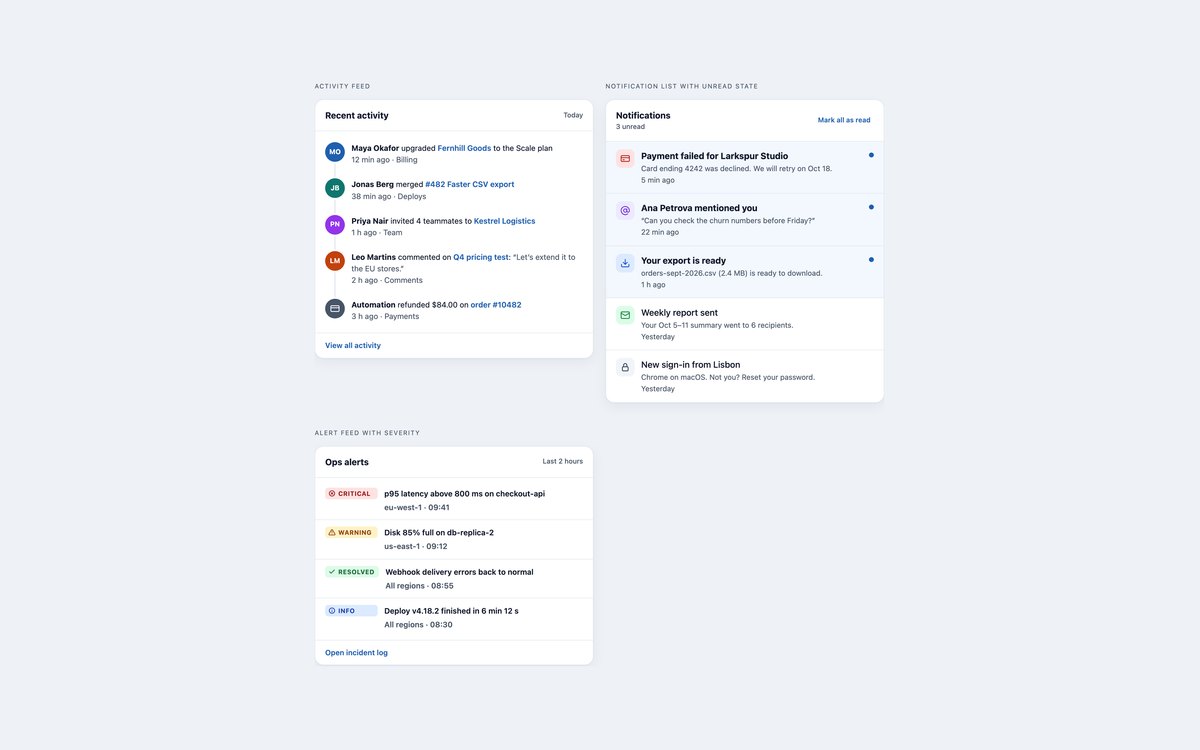
An activity timeline with avatars and links, a notification list with unread state, and an ops alert feed with Critical, Warning, Resolved and Info badges.
A few lines of JavaScript run the Mark all as read button and update the unread count in a live region; unread rows also carry a hidden Unread label.
Live Demo CSS, Bootstrap & Tailwind code
5. Leaderboard & Table Widgets
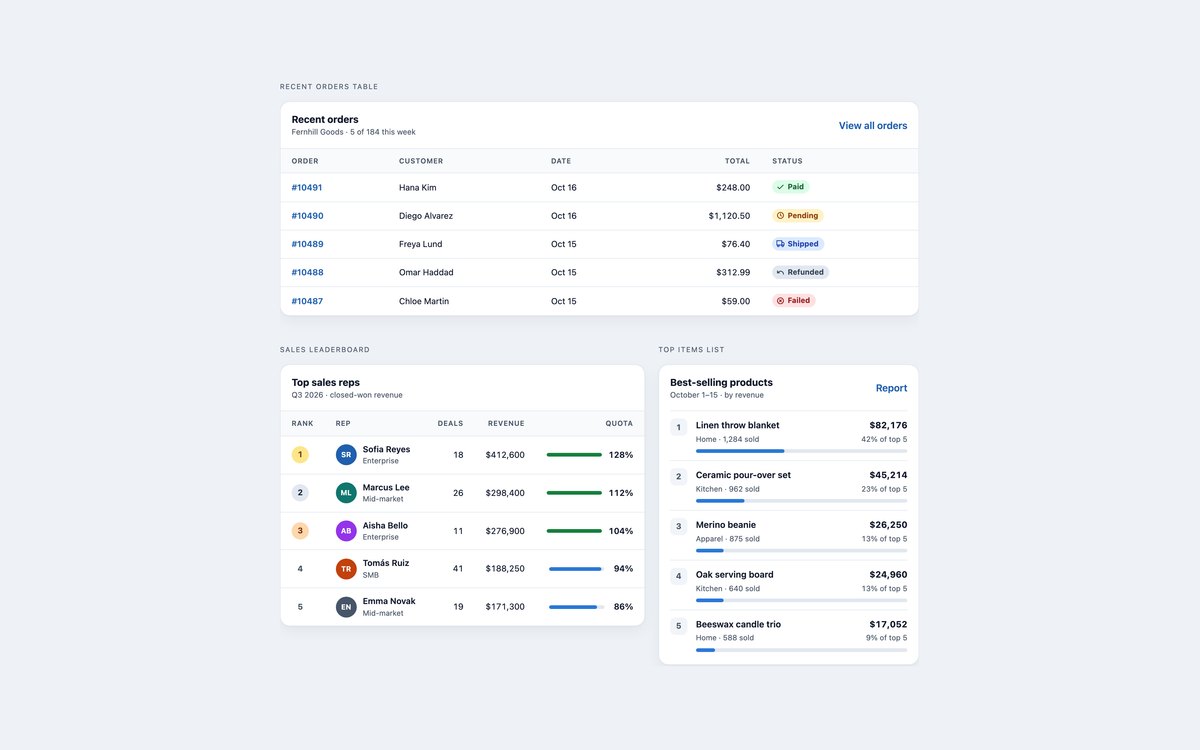
A recent orders table with status badges, a sales leaderboard with rank and quota bars, and a best-selling products list with share bars.
They are real tables with captions and scoped headers, and on phones they scroll sideways inside a region you can focus and scroll with the keyboard.
Live Demo CSS, Bootstrap & Tailwind code
6. Calendar & To-Do Widgets
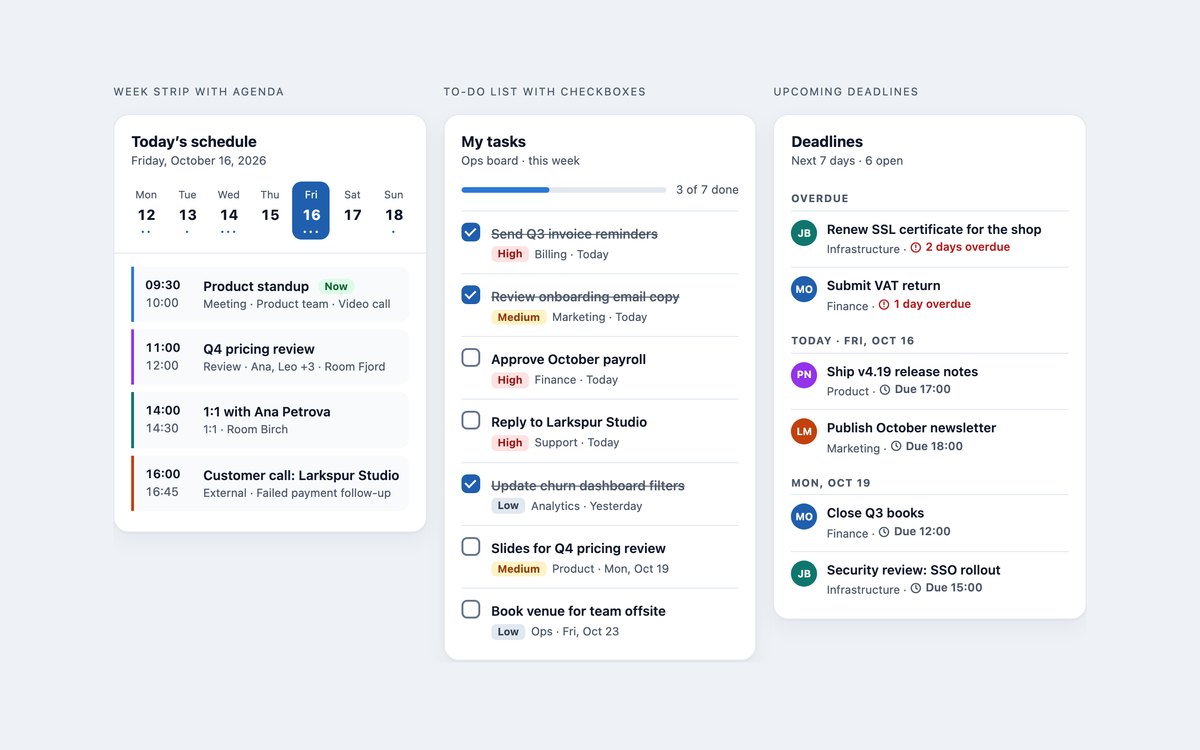
A week strip with today’s agenda, a to-do list on real checkboxes with priority tags, and upcoming deadlines grouped by day.
Today is marked with aria-current, finished tasks are struck through, and a short script keeps the done count and its bar in step.
Live Demo CSS, Bootstrap & Tailwind code
7. Dark Dashboard Widgets
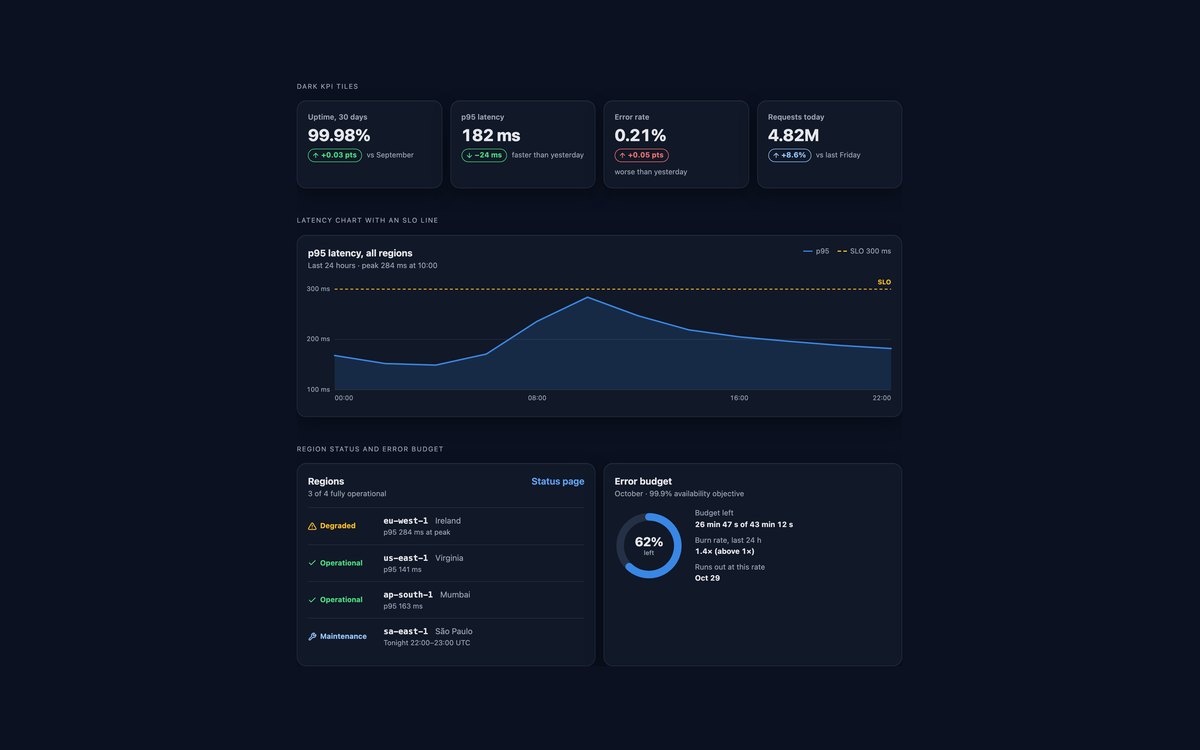
An ops dashboard on a near-black ground: KPI tiles, a p95 latency chart with a dashed SLO line, a region status list and an error budget ring.
The chart is a static SVG with HTML axis labels and a hidden data table, colours are checked for contrast on the dark card, and Bootstrap runs in data-bs-theme="dark".
Live Demo CSS, Bootstrap & Tailwind code
8. Modern CSS Dashboard Widgets
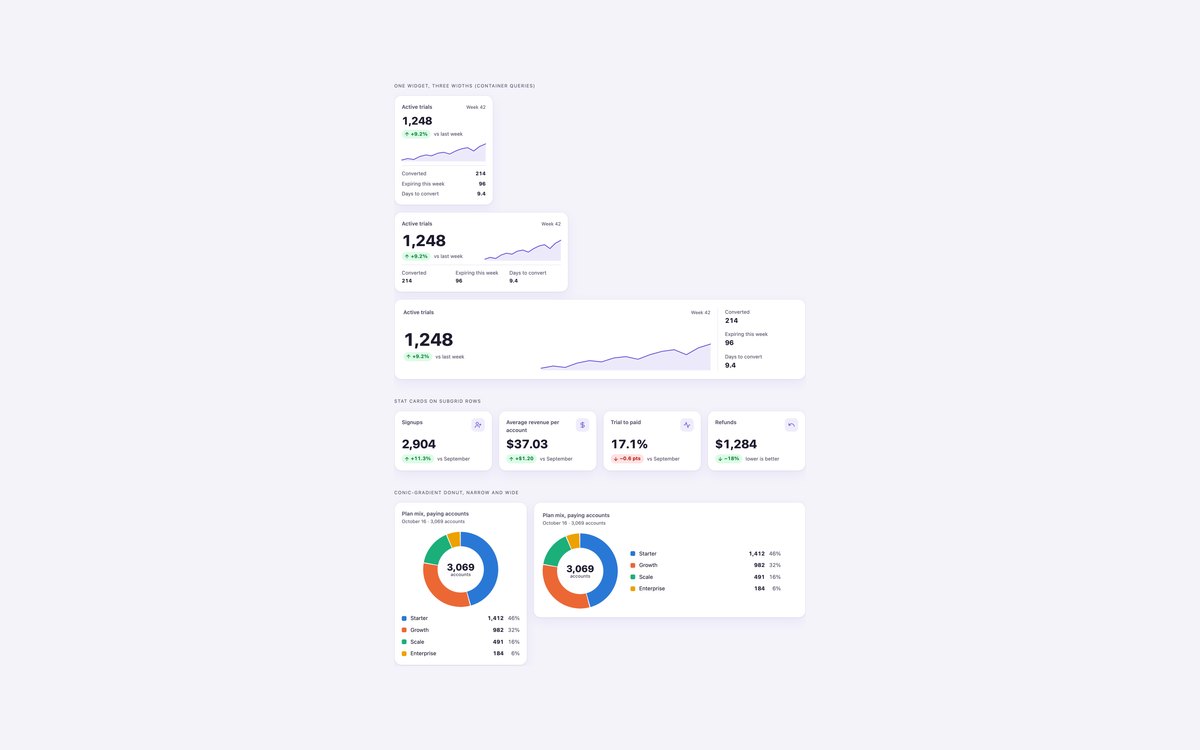
One widget shown at three column widths, stat cards whose values line up on subgrid rows, and a donut chart made from conic-gradient.
No JavaScript: container queries let each widget adapt to the column it sits in, and Tailwind uses @container, @min-[…] and grid-rows-subgrid.
Live Demo CSS, Bootstrap & Tailwind code
Frequently asked questions
Are these dashboard widgets free for commercial projects?
Yes. Every set is free for personal and commercial projects, including client work and products you sell. Attribution is optional but always welcome. The licence is at uicookies.com/license/.
Do the dashboard widgets need JavaScript or a chart library?
No chart library is used anywhere. Five of the eight sets are HTML and CSS only. The chart cards use a short vanilla script that draws SVG charts from each card’s data table, the notification list uses a few lines for its Mark all as read button, and the to-do list uses a few lines to keep its done count up to date. Without JavaScript the chart cards show their tables instead.
Are the widgets accessible?
Changes and statuses are written as words with icons, so they never depend on red and green alone. Every chart has its numbers in a captioned data table, progress rings and bars are labelled progressbars with value text, tables use scoped headers, and to-dos are real checkboxes with labels. Every control shows a visible focus outline, motion stops under prefers-reduced-motion, and every set passes an automated axe-core WCAG 2.1 AA check.
Which frameworks are included?
Every set has three files that look the same: plain HTML and CSS, Bootstrap 5.3.8 and Tailwind CSS 4. The Bootstrap files use .card, .table, .table-responsive, .progress, .list-group, .badge, .form-check and data-bs-theme="dark" where they fit, with a small style block for charts and rings. The Tailwind files use utility classes in the markup, with an @theme block for colours in some sets.
How do I make a chart in a dashboard card without a library?
Set 02 shows the approach: put the data in a normal HTML table inside the card, then let a short script read the rows and write an SVG with rect, path or circle elements sized from the values. Keeping the table means screen readers and users without JavaScript still get the numbers. For fixed data, set 07 uses a static SVG with HTML axis labels, and set 08 draws a donut with conic-gradient and no script at all.