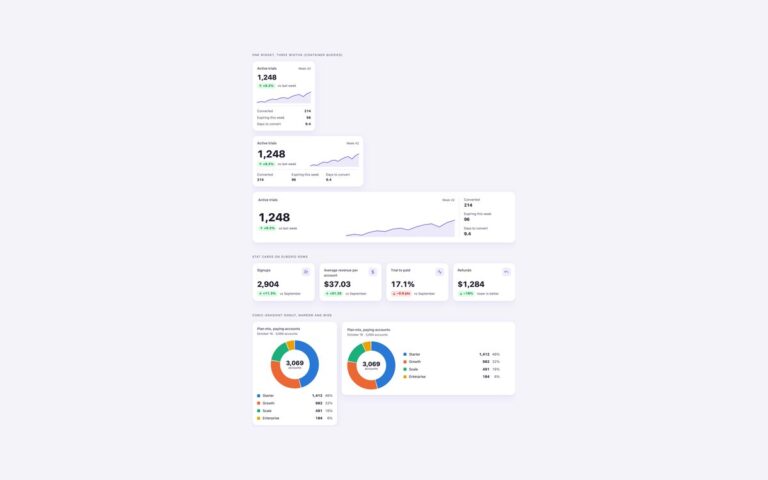
Three ways to show the numbers a dashboard opens with. KPI cards with sparklines is a row of four cards for net revenue, active subscribers, monthly churn and average order value: each has a label, the period, a large value, a delta pill and a small area sparkline that stretches to the card width. Compact tiles with icons packs four smaller stats (new signups, open tickets, first response time, NPS) next to an icon square, with a one-line trend. Hero metric with breakdown gives monthly recurring revenue a full-width card with a larger chart and a four-way split into new business, expansion, contraction and churn. Use the cards for a top row, the tiles where space is tight and the hero card for the one number the page is about. Direction is never carried by colour alone: every delta has a signed number, an arrow and words such as up from, down from or lower is better, so a falling churn rate reads as good news. The sparklines are inline SVG paths with a non-scaling stroke, marked aria-hidden because the text beside them already says what they show. No JavaScript.
What’s included
Four KPI cards with signed deltas and area sparklines
Compact icon tiles for dense dashboard rows
Full-width hero metric with a four-way MRR breakdown
Up and down shown by sign, arrow and wording, not colour alone
Inline SVG sparklines that stretch to any card width
Tabular figures so values line up
Accessibility
Each card has a heading for its label, and the value, delta and comparison are plain text in reading order. Good and bad changes use a signed number, an arrow and words, so they do not depend on red and green. Sparklines and icons are decorative and hidden from screen readers. Text and badges meet WCAG AA contrast.
Customise it
Change --kpi-accent for the sparklines and --kpi-good, --kpi-bad and their -bg partners for the delta pills on .kpi-set. In Bootstrap the same colours are Bootstrap variables such as --bs-success-text-emphasis set on .kpi-set; in Tailwind edit the kpi colours in the @theme block.