JSX
Copy
// Dark ops dashboard: KPI tiles, a p95 latency area chart with an SLO line (static SVG plus a
// visually hidden data table), region status and an error-budget ring. Colours come from the
// dk-* @theme tokens in the CSS block; status always pairs an icon with a word.
// Usage: <DarkOpsWidgets kpis={[…]} latency={[{ time, ms }]} regions={[…]} budget={{…}} />
import { useId } from 'react';

const TONE = { good: 'text-dk-good', bad: 'text-dk-bad', info: 'text-dk-info', warn: 'text-dk-warn' };
const ARROW = { up: 'M12 19V5M5 12l7-7 7 7', down: 'M12 5v14M19 12l-7 7-7-7' };

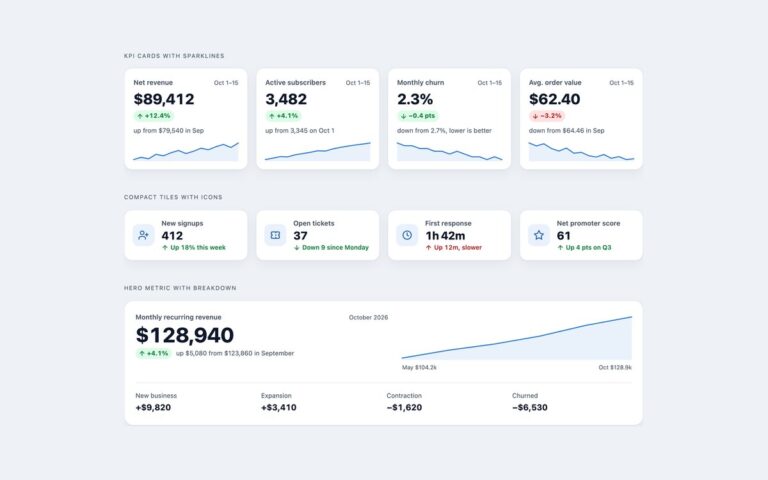
const defaultKpis = [
  { title: 'Uptime, 30 days', value: '99.98%', delta: '+0.03 pts', dir: 'up', tone: 'good', note: 'vs September' },
  { title: 'p95 latency', value: '182 ms', delta: '−24 ms', dir: 'down', tone: 'good', note: 'faster than yesterday' },
  { title: 'Error rate', value: '0.21%', delta: '+0.05 pts', dir: 'up', tone: 'bad', note: 'worse than yesterday' },
  { title: 'Requests today', value: '4.82M', delta: '+8.6%', dir: 'up', tone: 'info', note: 'vs last Friday' },
];

const defaultLatency = [
  { time: '00:00', ms: 168 }, { time: '02:00', ms: 152 }, { time: '04:00', ms: 149 }, { time: '06:00', ms: 171 },
  { time: '08:00', ms: 236 }, { time: '10:00', ms: 284 }, { time: '12:00', ms: 247 }, { time: '14:00', ms: 219 },
  { time: '16:00', ms: 205 }, { time: '18:00', ms: 196 }, { time: '20:00', ms: 188 }, { time: '22:00', ms: 182 },
];

const REGION_STATUS = {
  degraded: { label: 'Degraded', tone: 'warn', icon: <><path d="M12 9v4M12 17h.01" /><path d="M10.3 3.9 1.8 18a2 2 0 0 0 1.7 3h17a2 2 0 0 0 1.7-3L13.7 3.9a2 2 0 0 0-3.4 0z" /></> },
  operational: { label: 'Operational', tone: 'good', icon: <path d="M20 6 9 17l-5-5" /> },
  maintenance: { label: 'Maintenance', tone: 'info', icon: <path d="M14.7 6.3a1 1 0 0 0 0 1.4l1.6 1.6a1 1 0 0 0 1.4 0l3.8-3.8a6 6 0 0 1-7.9 7.9l-6.9 6.9a2.1 2.1 0 0 1-3-3l6.9-6.9a6 6 0 0 1 7.9-7.9z" /> },
};

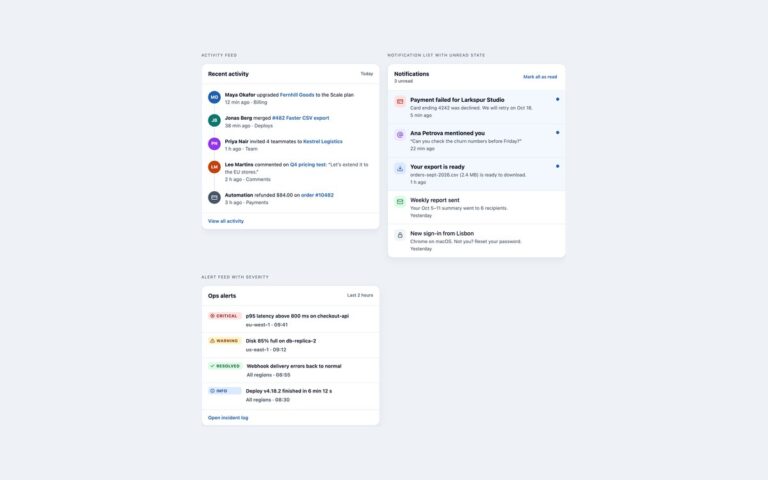
const defaultRegions = [
  { id: 'eu-west-1', place: 'Ireland', status: 'degraded', note: 'p95 284 ms at peak' },
  { id: 'us-east-1', place: 'Virginia', status: 'operational', note: 'p95 141 ms' },
  { id: 'ap-south-1', place: 'Mumbai', status: 'operational', note: 'p95 163 ms' },
  { id: 'sa-east-1', place: 'São Paulo', status: 'maintenance', note: 'Tonight 22:00–23:00 UTC' },
];

const defaultBudget = {
  objective: 'October · 99.9% availability objective', left: 62,
  facts: [
    { term: 'Budget left', value: '26 min 47 s of 43 min 12 s' },
    { term: 'Burn rate, last 24 h', value: '1.4× (above 1×)' },
    { term: 'Runs out at this rate', value: 'Oct 29' },
  ],
};

const panel = 'min-w-0 rounded-2xl border border-dk-line bg-dk-bg p-[18px] shadow-[inset_0_1px_0_rgba(255,255,255,.04),0_10px_30px_rgba(0,0,0,.35)]';
const label = 'mb-4 block text-[.72rem] tracking-[.12em] text-dk-muted uppercase';
const svgProps = { viewBox: '0 0 24 24', fill: 'none', stroke: 'currentColor', strokeWidth: '2.5', strokeLinecap: 'round', strokeLinejoin: 'round', 'aria-hidden': 'true' };

function KpiTile({ kpi: k }) {
  return (
    <article className={panel}>
      <h3 className="text-[.8rem] font-semibold text-dk-muted">{k.title}</h3>
      <p className="mt-1 mb-1.5 text-[1.8rem] leading-[1.2] font-[750] tracking-[-.02em] tabular-nums">{k.value}</p>
      <p className="flex flex-wrap items-center gap-2 text-[.78rem] text-dk-muted">
        <span className={`inline-flex items-center gap-[3px] rounded-full border border-current py-px pr-2 pl-1.5 font-bold tabular-nums ${TONE[k.tone]}`}>
          <svg className="size-[13px]" {...svgProps}><path d={ARROW[k.dir]} /></svg>{k.delta}
        </span>
        {k.note}
      </p>
    </article>
  );
}

// Static area chart in a 600×200 box; y runs from `min` (bottom) to `max` (top) milliseconds.
function LatencyChart({ points, slo = 300, min = 100, max = 320, ticks = [300, 200, 100], timeLabels = [0, 4, 8, 11] }) {
  const r1 = (v) => Math.round(v * 10) / 10;
  const x = (i) => r1((i * 600) / (points.length - 1));
  const y = (ms) => r1(200 - ((ms - min) / (max - min)) * 200);
  const line = points.map((p, i) => `${i ? 'L' : 'M'}${x(i)} ${y(p.ms)}`).join('');
  const peak = points.reduce((a, p) => (p.ms > a.ms ? p : a), points[0]);
  const pct = (v) => `${r1(v)}%`;
  return (
    <figure className={panel}>
      <div className="mb-3.5 flex flex-wrap items-start justify-between gap-3">
        <div><h3 className="text-base font-bold">p95 latency, all regions</h3><p className="text-[.8rem] text-dk-muted">Last 24 hours · peak {peak.ms} ms at {peak.time}</p></div>
        <p className="flex gap-3.5 text-[.76rem] text-dk-muted" aria-hidden="true">
          <span className="inline-flex items-center gap-1.5"><i className="w-4 border-t-2 border-dk-series" />p95</span>
          <span className="inline-flex items-center gap-1.5"><i className="w-4 border-t-2 border-dashed border-dk-warn" />SLO {slo} ms</span>
        </p>
      </div>
      <div className="relative ml-[46px] h-[190px]">
        <svg className="absolute inset-0 size-full overflow-visible" viewBox="0 0 600 200" preserveAspectRatio="none" aria-hidden="true">
          <line className="stroke-dk-line" x1="0" x2="600" y1="200" y2="200" vectorEffect="non-scaling-stroke" />
          <line className="stroke-dk-line" x1="0" x2="600" y1={y(200)} y2={y(200)} vectorEffect="non-scaling-stroke" />
          <path className="fill-dk-series opacity-16" d={`${line}L600 200L0 200Z`} />
          <path className="fill-none stroke-dk-series [stroke-width:2.5] [stroke-linecap:round] [stroke-linejoin:round]" d={line} vectorEffect="non-scaling-stroke" />
          <line className="stroke-dk-warn [stroke-dasharray:5_4] [stroke-width:1.5]" x1="0" x2="600" y1={y(slo)} y2={y(slo)} vectorEffect="non-scaling-stroke" />
        </svg>
        <div aria-hidden="true">
          {ticks.map((t) => (
            <span key={t} className="absolute right-[calc(100%+8px)] -translate-y-1/2 text-[.7rem] whitespace-nowrap text-dk-muted tabular-nums" style={{ top: pct(y(t) / 2) }}>{t} ms</span>
          ))}
        </div>
        <span className="absolute right-0 -translate-y-[120%] text-[.7rem] font-bold text-dk-warn" style={{ top: pct(y(slo) / 2) }} aria-hidden="true">SLO</span>
      </div>
      <div className="relative mt-1.5 ml-[46px] h-[22px] text-[.7rem] text-dk-muted tabular-nums" aria-hidden="true">
        {timeLabels.map((i, n) => {
          const edge = n === 0 ? '' : n === timeLabels.length - 1 ? '-translate-x-full' : '-translate-x-1/2';
          return <span key={i} className={`absolute ${edge}`} style={{ left: pct((i / (points.length - 1)) * 100) }}>{points[i].time}</span>;
        })}
      </div>
      <div className="sr-only">
        <table>
          <caption>p95 latency every two hours today, all regions. Objective: under {slo} ms.</caption>
          <thead><tr><th scope="col">Time</th><th scope="col">p95 latency</th></tr></thead>
          <tbody>{points.map((p) => <tr key={p.time}><th scope="row">{p.time}</th><td>{p.ms} ms</td></tr>)}</tbody>
        </table>
      </div>
    </figure>
  );
}

function Regions({ regions }) {
  const titleId = useId();
  const ok = regions.filter((r) => r.status !== 'degraded').length;
  return (
    <section className={panel} aria-labelledby={titleId}>
      <div className="mb-3.5 flex flex-wrap items-start justify-between gap-3">
        <div><h3 className="text-base font-bold" id={titleId}>Regions</h3><p className="text-[.8rem] text-dk-muted">{ok} of {regions.length} fully operational</p></div>
        <a href="#" className="rounded font-semibold text-dk-accent no-underline hover:underline focus-visible:outline-2 focus-visible:outline-offset-2 focus-visible:outline-dk-accent">Status page</a>
      </div>
      <ul>
        {regions.map((r) => {
          const s = REGION_STATUS[r.status];
          return (
            <li key={r.id} className="grid grid-cols-[118px_1fr] items-center gap-3 border-t border-dk-line py-[11px]">
              <span className={`inline-flex items-center gap-1.5 text-[.78rem] font-bold ${TONE[s.tone]}`}><svg className="size-[15px] flex-none" {...svgProps}>{s.icon}</svg>{s.label}</span>
              <div>
                <p className="font-mono text-[.88rem] font-semibold">{r.id} <span className="ml-1 font-sans font-normal text-dk-muted">{r.place}</span></p>
                <p className="text-[.76rem] text-dk-muted">{r.note}</p>
              </div>
            </li>
          );
        })}
      </ul>
    </section>
  );
}

function ErrorBudget({ budget: b }) {
  const titleId = useId();
  return (
    <section className={panel} aria-labelledby={titleId}>
      <div className="mb-3.5 flex flex-wrap items-start justify-between gap-3"><div><h3 className="text-base font-bold" id={titleId}>Error budget</h3><p className="text-[.8rem] text-dk-muted">{b.objective}</p></div></div>
      <div className="flex items-center gap-5">
        <div className="relative size-[118px] flex-none" role="progressbar" aria-labelledby={titleId} aria-valuemin={0} aria-valuemax={100} aria-valuenow={b.left} aria-valuetext={`${b.left}% of the error budget left`}>
          <svg className="size-full -rotate-90" viewBox="0 0 100 100" aria-hidden="true">
            <circle className="fill-none stroke-dk-line [stroke-width:11]" cx="50" cy="50" r="42" />
            <circle className="fill-none stroke-dk-series [stroke-width:11] [stroke-linecap:round] transition-[stroke-dasharray] duration-600 motion-reduce:transition-none" style={{ strokeDasharray: `${b.left} 100` }} cx="50" cy="50" r="42" pathLength="100" />
          </svg>
          <span className="absolute inset-0 grid place-content-center text-center text-[1.35rem] leading-[1.1] font-[750]" aria-hidden="true">{b.left}%<small className="block text-[.68rem] font-medium text-dk-muted">left</small></span>
        </div>
        <dl className="grid gap-2 text-[.8rem]">
          {b.facts.map((f) => (
            <div key={f.term}><dt className="text-dk-muted">{f.term}</dt><dd className="font-bold tabular-nums">{f.value}</dd></div>
          ))}
        </dl>
      </div>
    </section>
  );
}

export default function DarkOpsWidgets({ kpis = defaultKpis, latency = defaultLatency, regions = defaultRegions, budget = defaultBudget }) {
  return (
    <div className="flex flex-col gap-[46px] text-dk-ink">
      <div><span className={label}>Dark KPI tiles</span>
        <div className="grid grid-cols-[repeat(auto-fit,minmax(210px,1fr))] gap-3.5">{kpis.map((k) => <KpiTile key={k.title} kpi={k} />)}</div>
      </div>
      <div><span className={label}>Latency chart with an SLO line</span><LatencyChart points={latency} /></div>
      <div><span className={label}>Region status and error budget</span>
        <div className="grid grid-cols-[repeat(auto-fit,minmax(min(100%,300px),1fr))] gap-3.5"><Regions regions={regions} /><ErrorBudget budget={budget} /></div>
      </div>
    </div>
  );
}