About this set
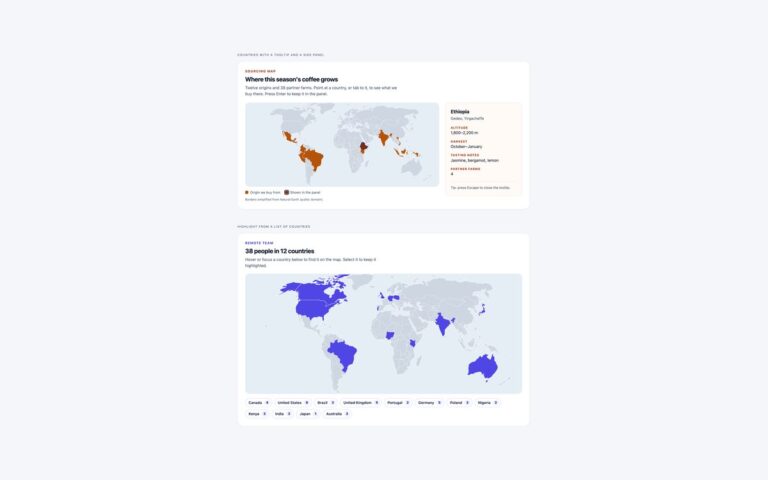
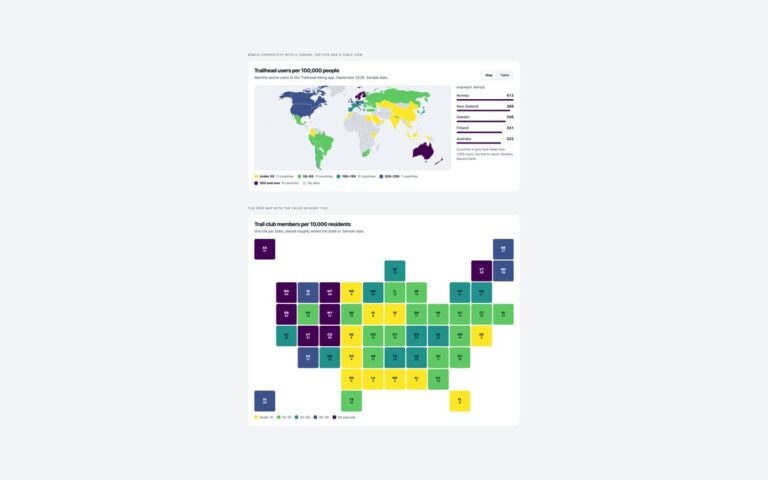
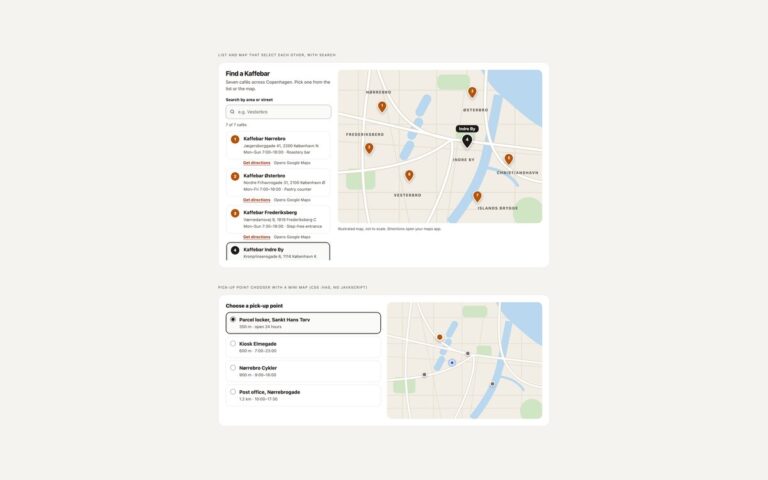
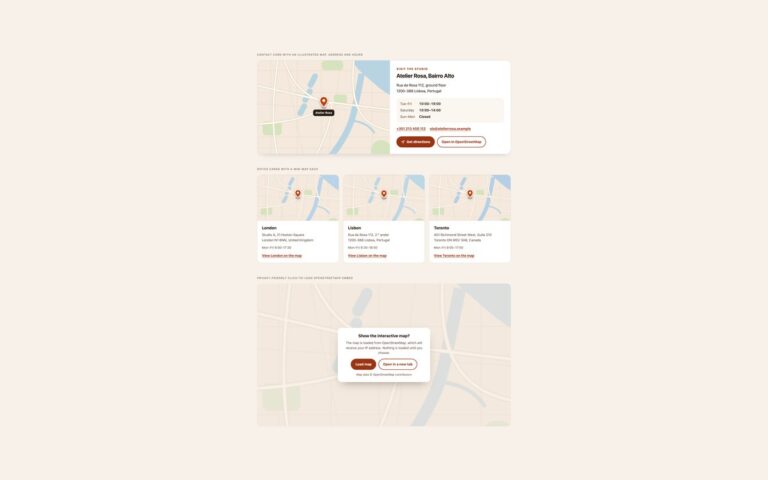
Two maps for dark dashboards and apps, drawn as inline SVG. The edge network map shows the world in deep slate with nine region nodes that glow, links that flow out from Frankfurt as animated dashed arcs, and amber nodes for regions that are degraded; next to it, a status list gives every region its health in words and its round-trip time in milliseconds, so the information never depends on colour or on seeing the map. The ride tracking card puts a dark street map beside the trip details: a glowing violet route from the car to a pulsing pick-up point, name tags on both ends, a large arrival time, the driver’s name, car and number plate, a four-step progress bar and two actions. The world geometry is the same Natural Earth data as set 01, and the city is the illustrated drawing used across the pack, recoloured for a dark theme. The Bootstrap version runs in data-bs-theme=”dark”. Neither map needs JavaScript; all motion is CSS and stops under reduced motion.
What’s included
- Glowing nodes and flowing arcs with CSS animation only
- Status list with health and latency written out
- Ride tracking card with route, ETA, driver and progress
- Natural Earth world geometry on a radial gradient
- Bootstrap version uses data-bs-theme="dark"
Accessibility
Both maps are images with a text description, and the facts they show are repeated as text: the region list names each status, and the ride card states the arrival time, distance, driver and plate. Muted text was kept at 4.5:1 or more on the dark backgrounds, buttons have a light focus outline, and the arc flow, node glow and pick-up ping stop under prefers-reduced-motion.
Customise it
Change the node colours in .dk-node and .dk-node.slow, the arc colour in .dk-arcs path, and the route colours in .dk-route and .dk-route-glow. The city drawing takes its land, water, park and road colours as parameters in the SVG fills.